Präsentation herunterladen
Die Präsentation wird geladen. Bitte warten

1
Statistik und Wirtschaftsforschung
Speaker: Mr. Carsten Fink, Chefökonom, Economics & Statistics Division , WIPO, Geneva

2
Organisation Economics and Statistics Division WIPO Chief Economist
IP Statistics Section Data Development Section Economics Section

3
Übersicht World Intellectual Property Indicators
World Intellectual Property Report Global Innovation Index

4
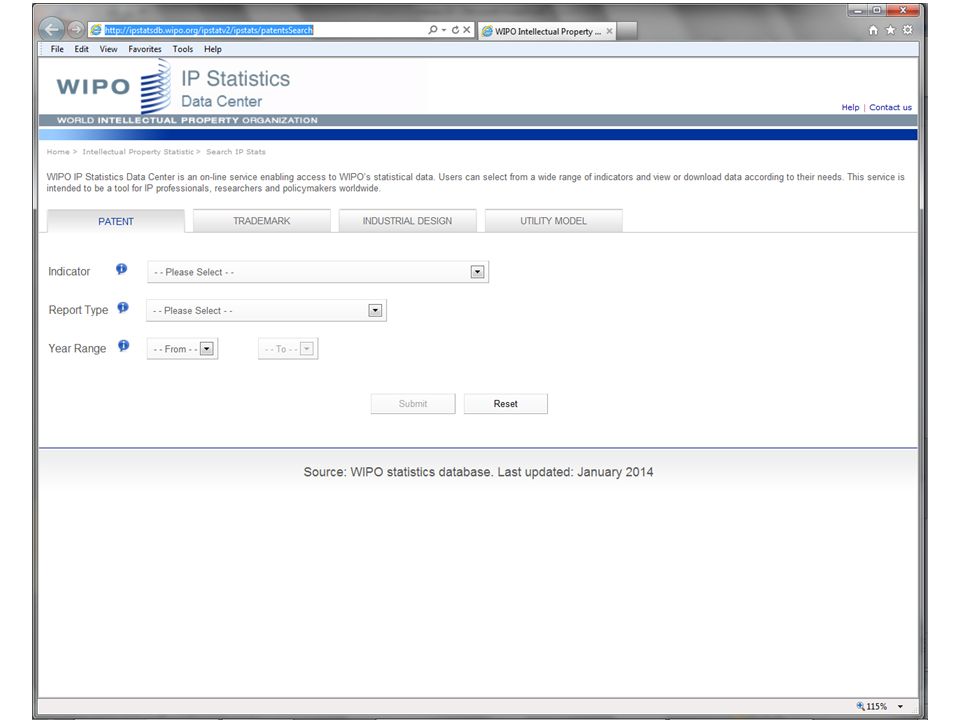
World Intellectual Property Indicators
Statistischer Jahresbericht Basierend auf weltweiter statistischer Umfrage Inhalt Patente Marken Geschmacksmuster Gebrauchsmuster Sortenschutz Veröffentlichung im Dezember

5
Schnellstes Wachstum seit 18 Jahren
Patentanmeldungen Schnellstes Wachstum seit 18 Jahren WIPO Statistics Database

7
Solides Wachstum im Jahr 2012
Markenanmeldungen Solides Wachstum im Jahr 2012 WIPO Statistics Database

8
Geschmacksmusteranmeldungen
Zweistelliges Wachstum seit 2010 WIPO Statistics Database

10
World Intellectual Property Report
Analytischer Bericht über die wirtschaftliche Rolle der Immaterialgüterrechte Veröffentlichung alle zwei Jahre Themen „Das wandelnde Gesicht der Innovation“ (2011) „Marken: Ruf und Image im globalen Markt“ (2013)
 „Marken: Ruf und Image im globalen Markt (2013)")
12
Wachsende F&E Ausgaben
WIPO: World Intellectual Property Report, 2011

13
Wachsende Investitionen in immaterielle Wirtschaftsgüter
WIPO: World Intellectual Property Report, 2011

14
Internationalisierung von Forschung und Innovation
WIPO: World Intellectual Property Report, 2011

15
Wachsende Nachfrage nach Patenten
WIPO: World Intellectual Property Report, 2011

16
Mehr Erfindungen und zunehmende Internationalisierung
WIPO: World Intellectual Property Report, 2011

17
Komplexe Technologien erfahren schnelleres Patentwachstum
WIPO: World Intellectual Property Report, 2011

19
Markenbildung im Zeitalter der Globalisierung
Marken überqueren leichter nationale Grenzen Firmen sorgen für eine weitgefasste „Markenerfahrung”; die Wahrnehmung von Marken geht über Produktqualität hinaus. Marken werden durch eine wachsende Anzahl an Kanälen kommuniziert Markenbildung ist nicht mehr das Monopol von Unternehmen

20
Weltweite Markeninvestitionen
Markeninvestitionen, Prozentsatz des BIP, WIPO: World Intellectual Property Report, 2013

21
Bessere Schätzung für die USA
Markeninvestitionen in den USA, Prozentsatz des BIP, Invesitionen in Markenbildung übersteigen Investitionen in F&E und Design WIPO: World Intellectual Property Report, 2013

22
KMUs benutzen vorwiegend Markenrechte
Anzahl von KMUs in Großbritannien, die Immaterialgüterrechte benutzen, WIPO: World Intellectual Property Report, 2013

23
Innovative Firmen benutzen Markenrechte am häufigsten
Anteil der herstellenden Firmen, die verschiedene Immaterialgüterrechte benutzen WIPO: World Intellectual Property Report, 2013

25
Hintergrund Entscheidungsträger halten Innovation für wichtig, aber es ist schwierig, die Innovationsleistungskraft von Volkswirtschaften zu messen Innovation geht über F&E Aktivitäten hinaus Ein perfektes Maβ gibt es nicht, aber es lohnt sich danach zu suchen simple goal: to determine metrics and approaches to better capture the richness of innovation in society and go beyond traditional measures of innovation. There were several motivations for setting this goal. • First, innovation was increasingly seen as critical for driving economic progress and competitiveness— both for developed and developing economies. Today, many governments are putting innovation at the centre of their growth strategies. • Second, there was awareness that the definition of innovation had broadened— it was no longer restricted to R&D laboratories and to published scientific papers. Innovation could be and was more general and horizontal in nature, and included social innovations, business model innovations and innovation in the creative sectors. • Last but not least, recognizing and celebrating innovation was seen as critical for inspiring people—especially the next generation of entrepreneurs and innovators.

26
Die Struktur des GII Is it biology, is it chemistry, it is a cocktail.
This holistic view of innovation is aligned with the principles underlying the design of the GII framework. Five input pillars capture elements of the national economy that enable innovative activities: (1) Institutions, (2) Human capital and research, (3) Infrastructure, (4) Market sophistication, and (5) Business sophistication. The Innovation Input Sub-Index is the simple average of the these five pillar scores. Innovation outputs are the results of innovative activities within the economy. There are two output pillars: (6) Knowledge and technology outputs and (7) Creative outputs. The Innovation Output Sub-Index is the simple average of these two pillar scores.
 Institutions, (2) Human capital and research, (3) Infrastructure, (4) Market sophistication, and (5) Business sophistication. The Innovation Input Sub-Index is the simple average of the these five pillar scores. Innovation outputs are the results of innovative activities within the economy. There are two output pillars: (6) Knowledge and technology outputs and (7) Creative outputs. The Innovation Output Sub-Index is the simple average of these two pillar scores.")
27
Die besten Zehn im Jahr 2013 GII Efficiency Ratio Output Sub-Index
Singapore Hong Kong (China) United States of America United Kingdom Sweden Finland Switzerland Denmark Canada Netherlands Malta Luxembourg Iceland Israel Germany Input Sub-Index Output Sub-Index Mali Moldova, Rep. Guinea Swaziland Indonesia Nigeria Kuwait Costa Rica Venezuela, Bolivarian Rep. Ireland Efficiency Ratio GII The United States rejoined the five most-innovative nations and the United Kingdom moved up to the third spot while Switzerland retained its place atop the rankings in the Global Innovation Index 2013, published by Cornell University, INSEAD, and the World Intellectual Property Organization (WIPO).
 United States of America. United Kingdom. Sweden. Finland. Switzerland. Denmark. Canada. Netherlands. Malta. Luxembourg. Iceland. Israel. Germany. Input Sub-Index. Output Sub-Index. Mali. Moldova, Rep. Guinea. Swaziland. Indonesia. Nigeria. Kuwait. Costa Rica. Venezuela, Bolivarian Rep. Ireland. Efficiency Ratio. GII. The United States rejoined the five most-innovative nations and the United Kingdom moved up to the third spot while Switzerland retained its place atop the rankings in the Global Innovation Index 2013, published by Cornell University, INSEAD, and the World Intellectual Property Organization (WIPO).")
28
Innovation im Vergleich zur wirtschaftlichen Entwicklung
Among the encouraging signs identified by GII 2013, 18 emerging economies are outperforming other countries in their respective income groups in order of distance: the Republic of Moldova, China, India, Uganda, Armenia, Viet Nam, Malaysia, Jordan, Mongolia, Mali, Kenya, Senegal, Hungary, Georgia, Montenegro, Costa Rica, Tajikistan and Latvia. All of them demonstrate rising levels of innovation compared with their peers. Even if progress is not uniform, this is a result of tackling the formulation of a good policy-mix on all meaningful fronts: institutions, skills, infrastructures, integration to global markets and linkages with the business community.

29
Danke für Ihre Aufmerksamkeit! carsten.fink@wipo.int

Ähnliche Präsentationen


 Mikroökonomie Peter Schmidt schmidt-bremen.de -> VWL 1 DSBW.>")


 Okt./Nov. 2008 IENA-Präsentation.>")


