Präsentation herunterladen
Die Präsentation wird geladen. Bitte warten

1
1. Der C-Transfer zwischen Pflanze und Boden 2. Kurfristige und längerfristige Reaktionen von Pflanzen und Rhizosphäre 3. Unterschiedliche Wirkungstärke von erhöhtem CO 2 auf unterschiedlichen Böden 4. Die Langzeitwirkungen: ein Nährstoffungleichgewicht entsteht Biodiversitäten ändern sich Fallbeispiel erhöhtes CO2

2
CO 2 Sink: Free Sugars in Plant and Soil Bulk soil Rhizosphere Soil Partikels (Carbonates) glucose and other free sugars in 1 kg soil: an average20 to 200 mg glucose and other free sugars in plants: an average of2 -10 mg g DM standing crop of grasses on 1 kg soil: an average of10 -20 g DM free sugars in the standing crop on 1 kg soil: an average of 20 -200 mg transfer rates ? Soil Respiration export leaching migration Root Biomass

3
LongitudinalSection 89 cm 24,4 cm 1,6 cm 30 cm 1 cm 2 cm 51 cm, 21 cm 12 cm 55 cm 9,25 cm 19,5 cm 7,5 cm 1,5 cm 10 cm 14,375 cm Cross Section Soil compartment 13 C steady state labelling: Begasungskammer © Gert Bachmann, Thomas Franz

4
13 C steady state labelling: the gas circuits © Gert Bachmann, Thomas Franz

5
Abschätzen von Transferraten durch 13 C labeling ambient: 350 mgL -1 CO 2 elevated: 750 mgL -1 CO 2

6
Von besonderem Interesse: C- Flüsse zwischen den Kompartimenten Blatt Stiel Achse Wurzel Rhizosphäre Boden 1 2 3 4 5 6 7 CO 2 Sproßraum Bodenkammer Knöll. CO 2 14,8 9,8 38,8 0,8 4,4 7,1 13,8 12,4 22,4 42,6 2,1 4,5 4,8 9,2 9,3 5,4 / 72,2 62,3 76,7 66,7 81,5 73,8 90,7 87,6 100 ?? 14,8 22,4 9,8 5,4 Flüsse ambient Flüsse elevated Pools ambient Pools elevated 8 CO 2 ?

7
Wurzel -40 -30 -20 -10 0 13 C Vollprobe gedüngt Leerprobe ungedüngt Sproß -40 -30 -20 -10 0 13 C Vollprobe gedüngt Leerprobe ungedüngt Hypothese: Pflanzen nehmen Kohlenstoff fakultativ auch aus dem Boden auf Vollproben mit 13 C markierter Glucose im Gießwasser gedüngt

8
pH Karbonat im Boden kann bei erhöhtem CO 2 ansteigen. after 3 months of cultivation n = 5 EB: SE

10
morphological changes after 6 months ambient CO 2 elevated CO 2 Trifolium r.

11
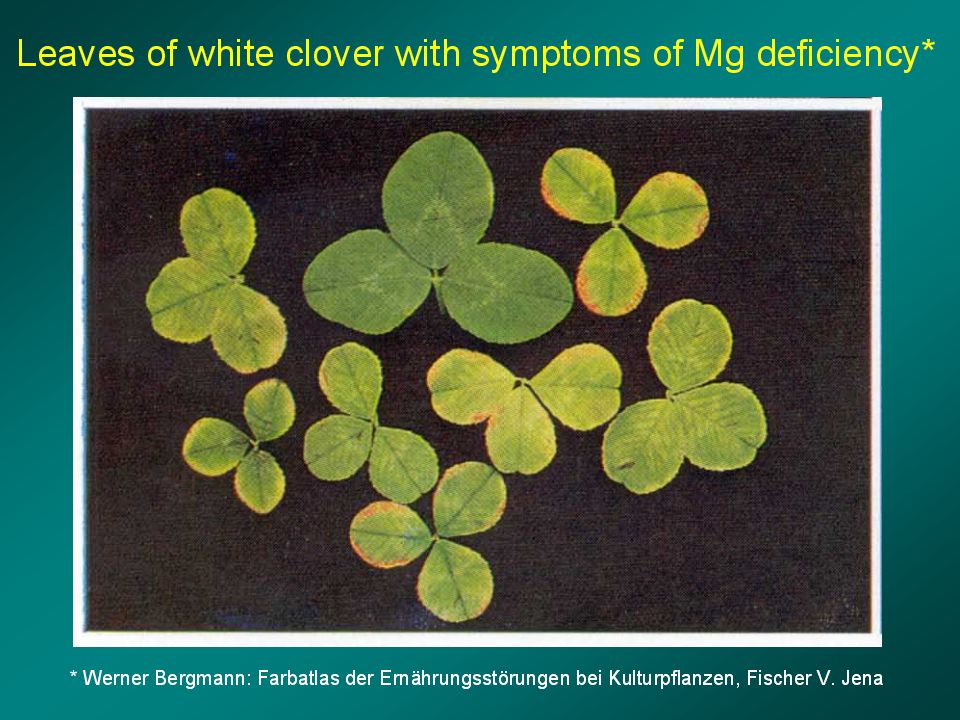
symptoms of cation deficiency ambient elevated

13
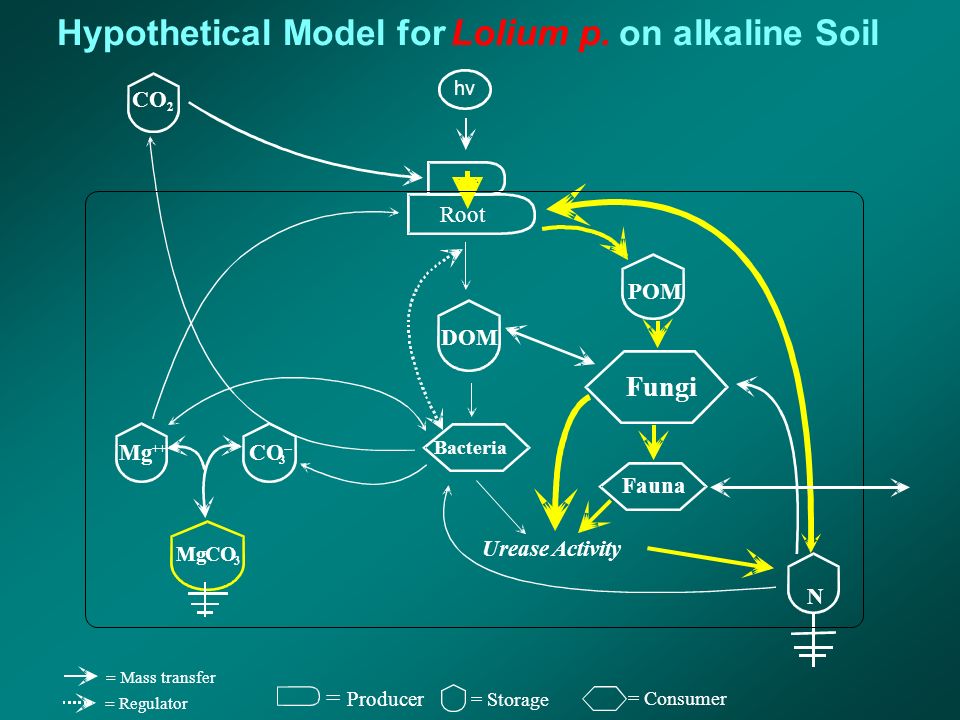
N 2 = Producer = Storage = Consumer hypothetical model forTrifolium r. on alkaline soil = Mass tranfer = Regulator Shoot Root

15
BIOLOG hours of incubation absorbance (TTF) sugars amino acids ambient CO 2 elevated CO 2 of organic acids aspartate citrate l-malate a-ketoglutarate f=y0+a/(1+exp(-(x-x0)/b))
 sugars amino acids ambient CO 2 elevated CO 2 of organic acids aspartate citrate l-malate a-ketoglutarate f=y0+a/(1+exp(-(x-x0)/b))")
16
0,00 1,00 2,00 3,00 4,00 5,00 6,00 7,00 8,00 Ditch control 15m Ditch 4mDitch 1mDitch Ground 0,00 5,00 10,00 15,00 20,00 25,00 Ca_HCl Mg_HCl pH K_HCl mg g soil DW mg g soil DW Ditch Ground: 1.41 % CO 3 -C low WRC high WRC Agrosol transsect

17
Dehydro Deaminase Phosphatas Urease Cellulase 13 C C_ges SIR BR thr ser glu ala val leu Glycerin Glucose Trehalose -4,7-2,7-0,71,33,35,3 -2,9 -0,9 1,1 3,1 5,1 Component 1 (53,1 %) Component 3 (10,6 %) ICAT-Hauptkomponenten RNE RE RNK RK BK BNE BNK BE
 Component 3 (10,6 %) ICAT-Hauptkomponenten RNE RE RNK RK BK BNE BNK BE")
18
-80 -60 -40 -20 0 20 40 60 80 100 3456789 %carbonate %C %SIR %DOM %BR %d13C %Urease % increase pH ICAT-Birmensdorf, FACE-Eschikon, SACE-Nenzlingen 1996-98 Soil pH determines strength of CO 2 Effects

19
3 Mg ++ Ca ++ soil air ground water 1 2 3 cation pools and sinks at elevated CO 2 plant biomass carbonates

20
range of probable systems elasticity stability recent ecosystem (neutral pH) environmental influences: temperature CO 2 rhizodeposition May elevated carbon dioxyde lead to persistent modifications of ecosystems? cation deficient system (acidic) resilience soil properties: (pH, water holding capycity) energy needed for permanent changes carbonate- adapted ecosystem (alkaline)
 resilience soil properties: (pH, water holding capycity) energy needed for permanent changes carbonate- adapted ecosystem (alkaline).")
21
Schlussfolgerungen: Beurteilung von Kohlenstoff- transferraten erfordert längere Beobachtungszeiträume und Markierungsexperimente Pflanzen können einer CO 2 - induzierten Alkalinisierung von Böden gegensteuern, aber nur für eine beschränkte Zeit Der Effekt von erhöhtem CO 2 auf Vegetationen und Böden hängt großteils von edaphischen Faktoren ab. (WRK, SAS, pH, KAK) Erhöhtes CO 2 führt langfristig wohl in allen Böden zu einer relativen Kationenmangelsituation.
 Erhöhtes CO 2 führt langfristig wohl in allen Böden zu einer relativen Kationenmangelsituation..")
Ähnliche Präsentationen


>")


