Präsentation herunterladen
Die Präsentation wird geladen. Bitte warten

1
45. Kongress der Deutschen Gesellschaft für Psychologie
Die ökonomische Bedeutung psychologischer Interventionen und warum wir sie alle unterschätzen Werner W. Wittmann Universität Mannheim 45. Kongress der Deutschen Gesellschaft für Psychologie Nürnberg, 17. – 21. September 2006

2
Gliederung Lokalkolorit Welche methodischen Fehler begehen wir in Forschung und Evaluation Was wissen wir über die Effektivität unserer Interventionen Eine einfache Idee, die Effektstärke am break-even Punkt und die Abschätzung eines ROI (return on investment) Koeffizienten Ausgewählte Beispiele
 Koeffizienten. Ausgewählte Beispiele.")
3
„Ökonomie ist zu 50% Psychologie!“
Ludwig Erhard: Franke und Begründer der sozialen Marktwirtschaft, Wirtschaftsminister und Bundeskanzler, Vater des Wirtschaftswunders „Ökonomie ist zu 50% Psychologie!“

4
Schüler- und Studenten= auswahl Laufbahnberatung Counseling
Die Anwendungsfelder psychologischer Interventionen und Strategien nach Pawlik (1976) Auswahlstrategien Personalauswahl Schüler- und Studenten= auswahl Laufbahnberatung Counseling Berufsberatung Erziehungsberatung Bedingungen Personen Personalentwicklung Training Therapie Arbeitsplatzgestaltung Organisationsentwicklung Umweltgestaltung Familientherapie Modifikationsstrategien
 Auswahlstrategien. Personalauswahl. Schüler- und Studenten= auswahl. Laufbahnberatung. Counseling. Berufsberatung. Erziehungsberatung. Bedingungen. Personen. Personalentwicklung. Training. Therapie. Arbeitsplatzgestaltung. Organisationsentwicklung. Umweltgestaltung. Familientherapie. Modifikationsstrategien.")
5
Evidenzbasierte Interventionen und Strategien?
Wissen wir was wir tun? Welche monetär und nicht monetär bewertbare Evidenzen kann die Psychologie vorweisen? Nur nichtmonetär bewertbare Evidenzen? Der Stellenwert systematischer Evaluationsforschung und Programmevaluation Meta-Analysen zu Synthese der Evidenz von Interventionen, Strategien und Programmen

6
Die Konzeption der fünf Datenboxen
Bewertungs- bereich Kriterien- zielbereich Programm Behandlung Intervention Ausgangslage Nordwest-Pfad EVA-Box KR-Box NTR-Box PR-Box ETR-Box rETR-KR rNTR-KR rPR-KR rPR-NTR rPR-ETR Südwest-Pfad

7
The Brunswik-lens-equation for relating experimental treatment (ETR) to criteria (CR)
Selection effects due to restriction (enhancement) of range 1 Danger to overestimate 1 Danger to underestimate Sampling error 1 Danger to overestimate (positive error) 1 Danger to underestimate (negative error) Psychometric reliability of experimental treatment and criterion 2 Dangers to underestimate Construct reliability of experimental treatment and criterion 2 Dangers to underestimate (lack of symmetry) There 6 dangers to underestimate against 2 dangers to overestimate A true effect size!
 of range. 1 Danger to overestimate. 1 Danger to underestimate. Sampling error. 1 Danger to overestimate (positive error) 1 Danger to underestimate (negative error) Psychometric. reliability of. experimental. treatment and. criterion. 2 Dangers to underestimate. Construct reliability. of experimental. treatment and. criterion. 2 Dangers to underestimate (lack of symmetry) There 6 dangers to underestimate against 2 dangers to overestimate A true effect size!")
9
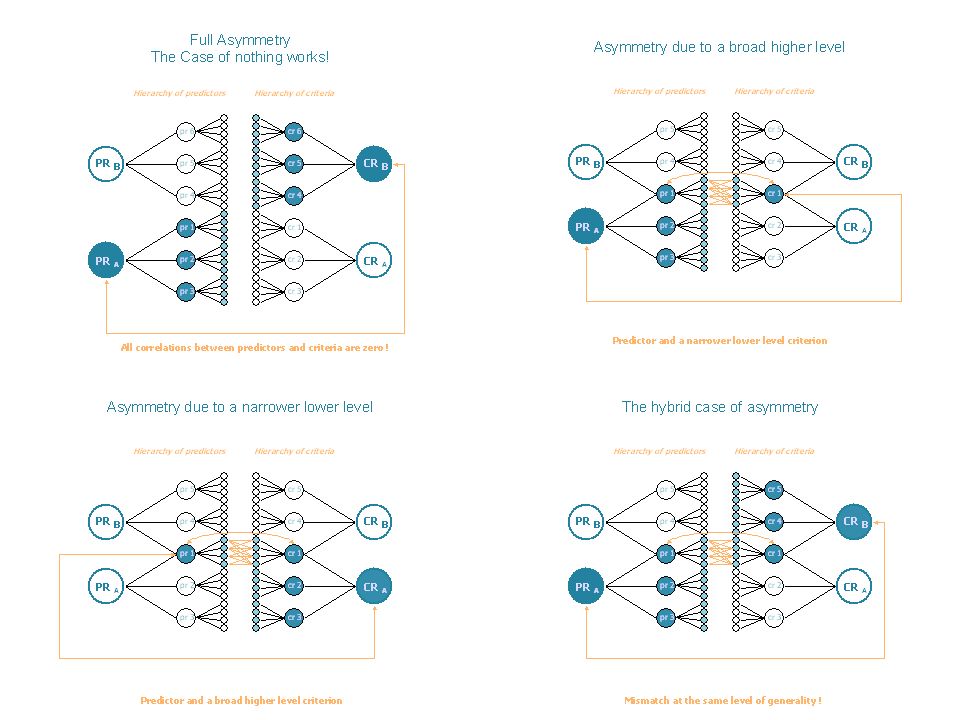
The beauty of Brunswik symmetry
ETR-Box PR-Box CR-Box NTR-Box ETR - Experimental Treatment Box PR - Predictor Box CR - Criteria Box NTR - Nonexperimental Treatment Box

10
Validität der einzelnen eignungsdiagnostischen Verfahren
Leistungstests Intelligenztests Arbeitsproben Assessment Center Biograph. Fragebogen Med. Begutachtung Interview Gruppengespräche Bewerbungsunterlagen Referenzen Individuelle Gespräche Zeugnisnoten Persönlichkeitstests Graphologie 0.05 0.10 0.15 0.20 0.25 0.30 0.35 0.40 0.45 0.50 0.55

11
Einsatzhäufigkeit der einzelnen eignungsdiagnostischen Verfahren
Leistungstests Intelligenztests Arbeitsproben Assessment Center Biograph. Fragebogen Med. Begutachtung Interview Gruppengespräche Bewerbungsunterlagen Referenzen Individuelle Gespräche Zeugnisnoten Persönlichkeitstests Graphologie 10% 20% 30% 40% 50% 60% 70% 80% 90% 100%

12
Asymmetrien zwischen Validität und Einsatzhäufigkeit: Konsequenz hohe Opportunitätskosten

13
The cost-benefit equation for selection decisions:
U=NPOS*rCR,PR*SDPROD*Z‘*DISC-NPOS*C/SR U: Utility(benefit) of selection strategy in $ NPOS: Number of positions to be filled rCR.PR: Validity (Pearson r) of strategy SDPROD: Standard deviation of productivity of those working on the job Z‘ : Average score of those selected on the assessment instrument in z-scores (mean=0,sd=1) SR: Proportion of those selected,i.e. the selection rate DISC: Discounting factor of utility given someone stays T-years on the job C: Cost of selection strategy per tested applicant DISC= ((1+i)T – 1)/(i*(1+i)T) i : Discounting proportion, e.g. the average inflation rate per year As a homework solve that equation to find out the break-even validity coefficient, similar to the break-even-point effect size we computed for interventions. Try an example of our own, what that break-even validity coefficient is, when you assess 1000 applicants for 100 open positions and you charge the company with 1000 $ per tested applicant. To compute Z‘ you need to know the selection rate SR and then look up the ordinate(Phi) of the normal curve at that selection rate from top down. Z‘= Phi/SR.
 of selection strategy in $ NPOS: Number of positions to be filled. rCR.PR: Validity (Pearson r) of strategy. SDPROD: Standard deviation of productivity of those working on the job. Z‘ : Average score of those selected on the assessment instrument in z-scores (mean=0,sd=1) SR: Proportion of those selected,i.e. the selection rate. DISC: Discounting factor of utility given someone stays T-years on the job. C: Cost of selection strategy per tested applicant. DISC= ((1+i)T – 1)/(i*(1+i)T) i : Discounting proportion, e.g. the average inflation rate per year. As a homework solve that equation to find out the break-even validity coefficient, similar to the break-even-point effect size we computed for interventions. Try an example of our own, what that break-even validity coefficient is, when you assess 1000 applicants for 100 open positions and you charge the company with 1000 $ per tested applicant. To compute Z‘ you need to know the selection rate SR and then look up the ordinate(Phi) of the normal curve at that selection rate from top down. Z‘= Phi/SR.")
14
Evaluating Programs With Kirkpatrick‘s Four Levels: Outcome criteria very popular in training and marketing research Level 1 - Reaction Level 2 - Learning Level 3 - Behavior Level 4 - Results Source: Kirkpatrick,D.L.(1998) Evaluating training programs.The four levels (2nd ed.). San Francisco:Berrett-Koehler Publishers,Inc.
 Evaluating training programs.The four levels (2nd ed.). San Francisco:Berrett-Koehler Publishers,Inc.")
15
Level Results Results can be defined as the final results that occurred because the participants attended the program. The final results can include increased production, improved quality, decreased costs, reduced frequency and/or severity of accidents, increased sales, reduced turnover, and higher profits. It is important to recognize that results like these are the reason for having some training programs. Therefore, the final objectives of the training program need to be stated in these terms.

16
Effektgrößemaße für die Intervention (d)
Die Brogden-Cronbach-Gleser Kosten-Nutzen-Analyse von Interventionen, das „Dornröschen“ der Kosten-Nutzen-Analyse: Folgende Kennwerte werden aus der Evaluationsforschung benötigt. Effektgrößemaße für die Intervention (d) Die Wirkungsdauer des Effektes (T) Die Anzahl der Trainierten,Therapierten,Rehabilitierten (N) Die Gesamtkosten pro Person (K) Die Standardabweichung der Produktivität (SDPROD) Die proportionale Überlappung des Effektes zur Produktivität (a) Diese Informationen können in folgender Nutzengleichung zusammengefasst werden, um den gesamten Nettonutzen (U) zu schätzen.
 Die Wirkungsdauer des Effektes (T) Die Anzahl der Trainierten,Therapierten,Rehabilitierten (N) Die Gesamtkosten pro Person (K) Die Standardabweichung der Produktivität (SDPROD) Die proportionale Überlappung des Effektes zur Produktivität (a) Diese Informationen können in folgender Nutzengleichung zusammengefasst werden, um den gesamten Nettonutzen (U) zu schätzen.")
17
Die Standardabweichung der Produktivität, das „Dornröschen“ Kosten-Nutzen-Gleichung
Ökonomen scheiterten SDProd zu schätzen und ins „Leben“ zu erwecken Zwei Psychologen, Frank Schmidt und Jack Hunter gelang es jedoch erste brauchbare Schätzungen vorzulegen Die Faustregel 40-70% des Gehalts L. Erhard hätte dies sicherlich gefreut basieren diese Schätzungen doch auf Prinzipien der Marktwirtschaft Wann erhalten beide endlich den Nobelpreis für Ökonomie?

18
Gene Glass Frank Schmidt Robert Rosenthal
Meta-Analyse, der Königsweg zur Evidenz: Drei Männer und Ansätze der „Ersten Stunde“ Gene Glass Frank Schmidt Robert Rosenthal

19
% Variance due to sampling error
Meta-analysis results of the relationship between design and evaluation features and the effectiveness of organizational training (Arthur et al. 2003) Training design and evaluation features No. Of data points (k) N Sample-weighted M d Corrected SD % Variance due to sampling error Evaluation criteria Reaction 15 936 0.60 0.26 50.69 Learning 234 15,014 0.63 0.59 16.25 Behavioral 122 15,627 0.62 0.29 28.34 Results 26 1,748 0.46 23.36
 Training design and evaluation features. No. Of data points (k) N. Sample-weighted M d. Corrected SD. % Variance due to sampling error. Evaluation criteria. Reaction Learning , Behavioral , Results ,")
20
Frage: Welche Effektstärken müssen wir dafür wenigstens erzielen?
Die einfache Idee: Frage: Unter welchen Rahmenbedingungen wiegt der Nutzen die Kosten gerade auf? Frage: Welche Effektstärken müssen wir dafür wenigstens erzielen? Antwort: Über Break-Even-Point Analyse Bruttonutzen = Kosten N * T * SDPROD * d * a = N * K Antwort:

21
Effect size at the break-even-point an example:
Assume that a training program total cost C=8000$ per trainee, The effect holds on for two years (T= 2). The outcome measure assessing communications skills to improve costumer oriented selling has an overlap of a=.60 with productivity. Yearly salary in that job category is 40000$ and we use the 70% estimate, thus SDPROD= 28000$. d = 8000$/(2*.60*28000$); d = .24 In Cohen‘s classification this is an effect close to a small one and meta-analysis results might additionally hint that programs similar to the one we use or want to evaluate have still larger effects. Computing such a break-even point effect size a priori has several advantages and pay offs. In doing program evaluation you always have to anticipate the fears, anxiety and non-complaince of those being evaluated. The information about the effect size at the break-even point as being low or relatively low may make those who already developed and deliever the program confident that they surely will outperform such an effect size. In another scenario we might fear that a program, which is in the planning phase and for which a prototype is considered to be developed is so costly that it needs a very large effect size at the break-even point. Thus we might either cancel that program idea or try to develop it at a much lower cost budget. Comparing the break-even effect sizes to those we already know from meta-analysis can convince stakeholders about the worth of such programs.
. The outcome measure assessing communications skills to improve costumer oriented selling has an overlap of a=.60 with productivity. Yearly salary in that job category is 40000$ and we use the 70% estimate, thus SDPROD= 28000$. d = 8000$/(2*.60*28000$); d = .24. In Cohen‘s classification this is an effect close to a small one and meta-analysis results might additionally hint that programs similar to the one we use or want to evaluate have still larger effects. Computing such a break-even point effect size a priori has several advantages and pay offs. In doing program evaluation you always have to anticipate the fears, anxiety and non-complaince of those being evaluated. The information about the effect size at the break-even point as being low or relatively low may make those who already developed and deliever the program confident that they surely will outperform such an effect size. In another scenario we might fear that a program, which is in the planning phase and for which a prototype is considered to be developed is so costly that it needs a very large effect size at the break-even point. Thus we might either cancel that program idea or try to develop it at a much lower cost budget. Comparing the break-even effect sizes to those we already know from meta-analysis can convince stakeholders about the worth of such programs.")
22
Das Return on Investment Konzept (ROI)
Vergleichen wir nun unseren Effekt am break-even-point mit den Effekten,die wir aus Meta-Analysen kennen, so können wir den ROI-Koeffizienten für diese Interventionen abschätzen: ROI= dMetanalyse/dbreak-even In unserem Beispiel aus der Meta-Analyse von Arthur et al. ist der Effekt für Results (monetär) d= .62 also : ROI(Personaltraining) = .62/.24 = Solche ROI‘s sind beträchtlich und lassen erheblichen Spielraum für Sensitivitätsanalysen, d.h. auch unter konservativen Szenarien bleiben sie in einer Höhe mit der psychologische Interventionen absolut konkurrenzfähig zu anderen Investitionsentscheidungen sind.
 d= .62 also : ROI(Personaltraining) = .62/.24 = Solche ROI‘s sind beträchtlich und lassen erheblichen Spielraum für Sensitivitätsanalysen, d.h. auch unter konservativen Szenarien bleiben sie in einer Höhe mit der psychologische Interventionen absolut konkurrenzfähig zu anderen Investitionsentscheidungen sind.")
23
THE RETURN ON INVESTMENT CONCEPT (ROI)
Problem: Nobody is satisfied just getting back the money invested after a year. The amount of money returned after a year should be larger. Thus this quotient of money invested to money returned, which is labeled as ROI should be larger then one, i.e. : ROI > 1 But how much larger? To get a feeling what ROI-coefficients are considered as impressive we can look at other areas! Interest rates mirror this for example. As psychologists we have to compete against other stakeholders with respect to investment decisions. Should someone invest money in programs we have to offer or would that investment result into a waste of money or opportunity costs? How can we a-priori answer such a question? As you will see we can answer this question. We will build a bridge of mutual understanding between psychology and economy

24
d necessary = ROI* dBreak-Even and using data from the example above:
Computing an effect size necessary to compete with others claiming to have a certain ROI Other competitor about investments may claim having a ROI=2, which means after a year for each dollar the investor get two dollars back. Impressive indeed. Can we compete, what effect size do we have to demonstrate to get a similar ROI? Well d necessary = ROI* dBreak-Even and using data from the example above: d necessary = 2 * .24 d necessary = .48! This is a medium sized effect only. So shouldn‘t we be confident in competing? Our competitors about scarce funds might claim having impressive ROI‘s of their programs and might claim so called opportunity costs, once we get the money. Opportunity costs is money lost due to opportunities not taken. If investments go the areas and programs with lower ROI‘s instead of higher ones we loose money. Assume that our program actually demonstrates a d=.80, then we know that our ROI is still larger than those of our competitors about the scarce funds and not investing in us will lead to opportunity costs! What a message for political and financial decision making, if we can bolster it by systematic program evaluation research?!

25
Lipsey and Wilson (1993) effect size distribution
 effect size distribution")
26
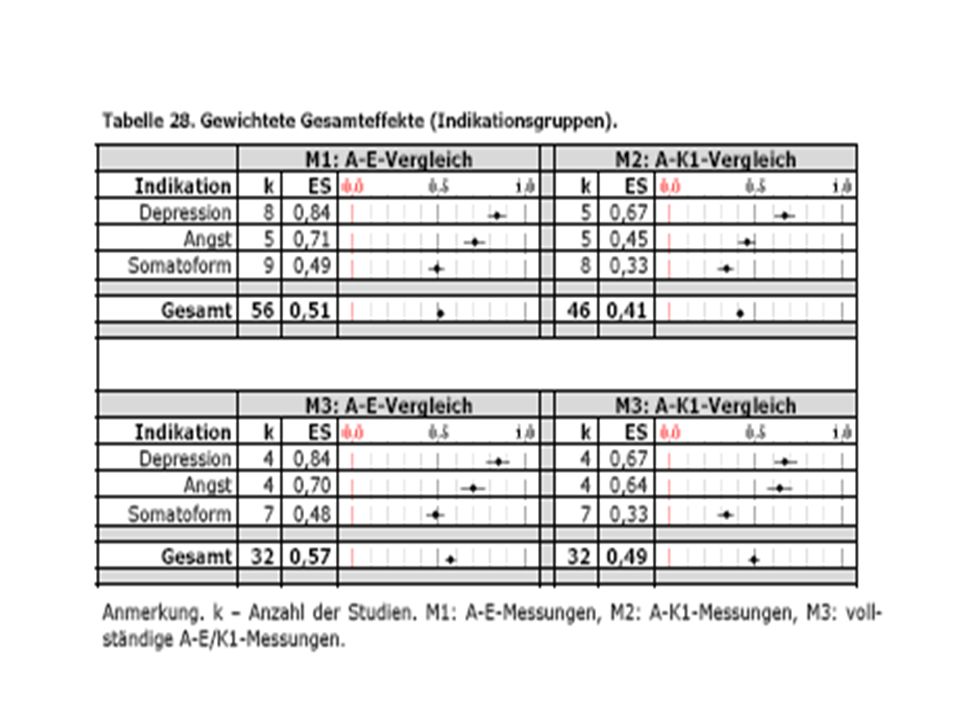
Evidenz aus umfassenden Evaluationsstudien zur Ergebnisqualität in der psychosomatischen Rehabilitation mit mindestens einem Katamnesezeitpunkt (Auswahl) Tab. 1 im gleichen Verzeichnis 1 Studien mit Zugang zu den Primärdaten (Stand August 2000)
")
28
Frage: Wie groß ist das „Dornröschen“ SDPROD?
Antwort: Vielen Dank an Frank Schmidt und Jack Hunter! Deren systematische Forschungsarbeiten haben gezeigt, dass SDPROD über viele Berufsfelder hinweg zwischen 40 % und 70 % des Jahreseinkommens lag. Die neueren Untersuchungen, auch unsere eigenen, zeigten Werte von 70 % und größer! Bei 13 Monatsgehältern wären dies 13 * 2.000,- Euro =26.000,- Euro, davon 70 % SDPROD = ,- Euro Die proportionale Überlappung unserer Ergebnismaßes sei: a= .60 (bei einem rein monetären Maß ist a=1.0)
")
29
Die Effektstärke am Break-Even-Point ist damit:
! Meta-Analysen liefern Evidenz, ! daß wir weit über dem Break Even liegen

30
DAS RETURN ON INVESTMENT KONZEPT (ROI)
Problem: Natürlich ist niemand zufrieden, wenn er/sie gerade die Investitionskosten wieder nach einem Jahr zurück bekommt. ROI sollte größer EINS sein! ROI > 1 aber wieviel? Wie groß sind ROI‘s in anderen Lebensbereichen? Nehmen wir an, wir möchten ROI = 2 Wie groß muss dann unsere Effektstärke d sein? d = 2*dbreak-even ; allgemein dgewünscht = ROI * dbreak-even In der Beispielrechnung muß die Reha dann folgenden Effekt zeigen: d= 2*.37; d.h.: d=.74

31
Der Effekt beträgt fast eine ganze Standardabweichung.
Effektgröße d für EMEK_27 EQUA-Studie (Schmidt, Nübling, Steffanowski & Wittmann, 2002) EMEK_27 vor Reha: EMEK_27 nach Reha: d = (17,1 – 12,0) / 5,3 d = 0,96 Der Effekt beträgt fast eine ganze Standardabweichung. Dem durchschnittlichen Patienten geht es insgesamt besser als 84 % der Patienten vor der stationären psychosomatischen Rehabilitation! ROI = d / d BREAK-EVEN = 0,96/0,37; ROI = 2,59 !
 EMEK_27 vor Reha: EMEK_27 nach Reha: d = (17,1 – 12,0) / 5,3. d = 0,96. Der Effekt beträgt fast eine ganze Standardabweichung. Dem durchschnittlichen Patienten geht es insgesamt besser als 84 % der Patienten vor der stationären psychosomatischen Rehabilitation! ROI = d / d BREAK-EVEN = 0,96/0,37; ROI = 2,59 !")
32
Monetär bewertbare Nutzenaspekte (Zielke, 1995) (Objektiv erhobene Daten in Einzelbetriebskrankenkassen aus Baden-Württemberg, Nordrhein-Westfalen, Rheinland-Pfalz) Tab2.doc im gleichen Verzeichnis Errechnete Kosten-Nutzen-Relation je Patient (Gesamt) 1 : 2,49 ROI = 2,49 je erwerbstätiger Patient 1 : 3,46 ROI = 3,46
 1 : 2,49 ROI = 2,49 je erwerbstätiger Patient 1 : 3,46 ROI = 3,46.")
33
Wir setzten die Werte in unsere Kosten-Nutzengleichung ein:
OPPORTUNITÄTSKOSTEN Ein Beispiel zur Veranschaulichung der Konsequenzen falscher gesundheitspolitischer Entscheidungen Annahme: Eine Einrichtung erzeugt eine durchschnittliche Effektstärke von d = 1,00 im Laufe eines Jahres werden 1000 Patienten behandelt: N = 1000 Der Behandlungseffekt hält 2 Jahre (T) lang an: T = 2 Die Kosten pro Patient betragen - direkt 5.000,- € (Behandlungskosten) - indirekt 3.000,- € (Lohnfortzahlung für 1,5 Monate): K = 8.000,- € Die Standardabweichung der Produktivität beträgt 70% des Jahresgehaltes (13 * 2.000,- € = ,-€) ergibt: SDPROD = ,- € Der erzielte Globaleffekt korreliert zu .60 mit der Produktivität: a=.60 Wir setzten die Werte in unsere Kosten-Nutzengleichung ein: U = N * T * SDPROD * d * a N * K ; d.h. U = 1000 * 2 * € * 1 * , * € U = ,- € ,- € U = ,- Millionen € an entgangenem Nutzen (Opportunitäten) = Opportunitätskosten
 lang an: T = 2 Die Kosten pro Patient betragen - direkt 5.000,- € (Behandlungskosten) - indirekt 3.000,- € (Lohnfortzahlung für 1,5 Monate): K = 8.000,- € Die Standardabweichung der Produktivität beträgt 70% des Jahresgehaltes (13 * 2.000,- € = ,-€) ergibt: SDPROD = ,- € Der erzielte Globaleffekt korreliert zu .60 mit der Produktivität: a=.60. Wir setzten die Werte in unsere Kosten-Nutzengleichung ein: U = N * T * SDPROD * d * a - N * K ; d.h. U = 1000 * 2 * € * 1 * , * € U = ,- € ,- € U = ,- Millionen € an entgangenem Nutzen (Opportunitäten) = Opportunitätskosten.")
34
Demands on the workforce
CP SNOW‘s distinction of the two cultures Buz Hunt‘s question: Will we be smart enough? Camilla Benbow and David Lubinski‘s focus on tilted profiles in aptitude and achievement The two cultures of CP Snow hint to the problem of our elites, which do not really communicate and understand each other due to very different aptitude, knowledge and interest profiles. Hunt asks question about the impact the demands of the workplace have on the incoming workforce. Do their profiles match the demands? How much have these demands changed? Benbow and Lubinski have shown the importance of verbal and quant tilted profiles in the longitudinal studies of a sample of very gifted students with respect to type of professions and workplaces into which they migrated. An important result among many others was that life satisfaction was best when the profiles matched the demands of the workplace.

35
Tilted Profiles 200 500 800 200 500 800 Upper third Middle third
Lower third QUANT VERBAL VERBAL QUANT VERBAL QUANT Tilted profiles vary between gender groups with many more women having verbal tilted than math/quant tilted ones compared to men.

36
Tilted Profiles as demands of the workplace
200 500 800 200 500 800 VERBAL What workplaces contribute most to GNP? This one with heavy emphasis on verbal and written communication? But, who has translated the meaning of the numbers and their causal implications for the strategies they are talking and writing about in order to push their organization forward? QUANT

37
Tilted Profiles as demands of a different workplace
200 500 800 200 500 800 QUANT Or is it this one, where the new high-tech products are invented, developed and tested? VERBAL

38
Even Profiles of still another one
200 500 800 200 500 800 VERBAL QUANT What are the percentages of workplaces with demands on high level verbal or quant tilted profiles? Someone has to invent and develop the new products and others need to convince customers, market and sell them. How are these different cultures related to each other? A nice case example would be Boeing, Seattle compared to Airbus, Europe.

39
Here are the results after rescaling realgdp per capita
Here are the results after rescaling realgdp per capita. The outliers are understandable, Qatar sits on a sea of oil, Barbados according to Lynn&Vanhanen profits from Bristish organized tourism and China (CHN) only recently started to change ist economic system.
 only recently started to change ist economic system.")
40
This analysis uses 24 countries only which can be labeled as economically developed countries. Because we are mainly interested in the relationship to education assessed by PISA2003, we partialled out the advantage by oil and former economic system, which is known as the inefficient socialistic system shared by East European countries formerly related to the Soviet Union. The countries above the regression line do better than we would expect from their level of education in terms of the reading/math composite, those below do worse than expected.

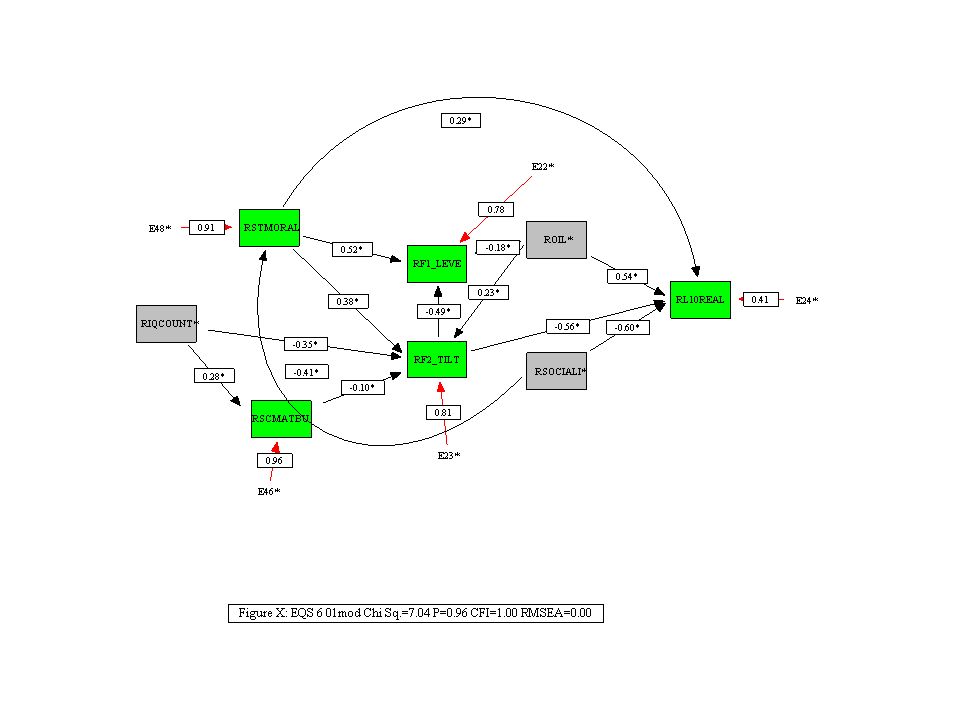
41
Here the countries with math tilted profiles do much better than those with even and verbal tilted ones. From level and tilt alone it is amazing how well the Czech Republic does. Maybe it will be the country out of the former Eastern socialist block, which will close the gap first to the rest of the economical lucky ones. Maybe CZE has done its homework in terms of level and tilt for the demands on the incoming workforce? Switzerland performs pretty well, they obviously have good math education, but they profit as well from money of the rest of Europe, which tries to escape the higher tax rates at home. The same would be true for Luxembourg, which even outperforms the US in terms of GDP, so Luxembourg was not included in the data analysis. Amazing is also the poor performance of the US in terms of level and tilt, but the US compensate this problem by attracting the best students from the rest of the world to their technical, engineering and science schools to satisfy the demands of their hi-tech economy in terms of level and tilt. Will homeland security issues counterattack these demands?

42
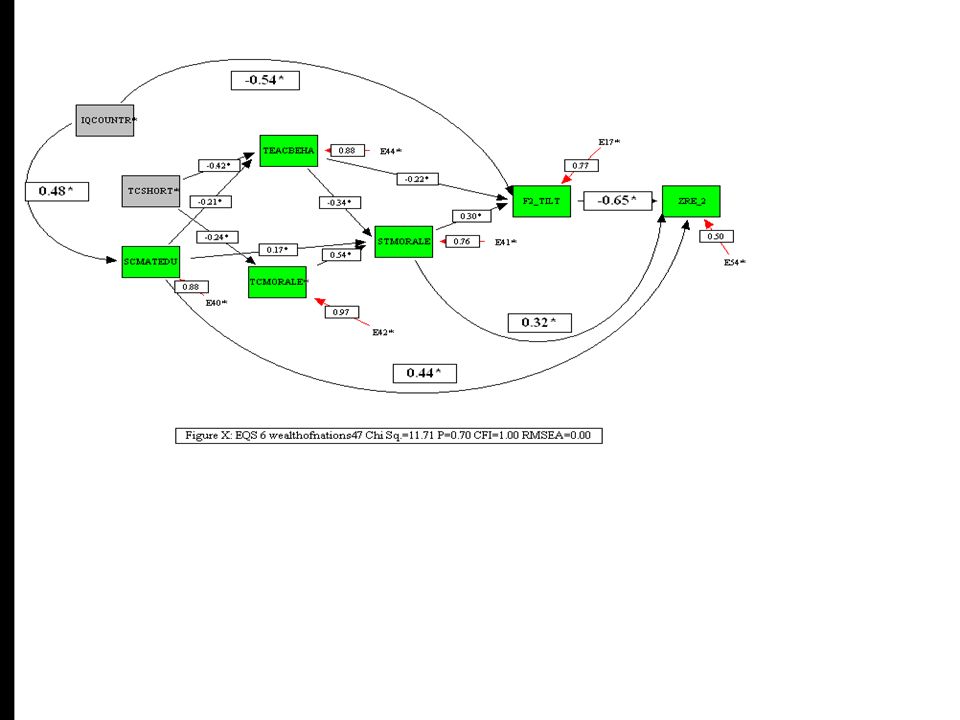
EQS PATH-Diagram: PISA_causalmodel1
List of the 24 countries used for this model analysis: AUT BEL CAN CHE CZE DNK ESP FIN FRA GBR GER GRC HUN IRL ITA JPN NLD NOR POL PRT SVK SWE USA STMORALE: Student moral index SCMATEDU: Quality of educational materials PROPMATH: proportion of math teachers A detailed description of these indices is to be found in VariableInformation_Schoolindices.doc IQ_COUNT: Country IQ from Lynn&Vanhanen ZRE:2: Logrealgdp from Lynn&Vanhanen with oil and socialism dummies partialled out. AUS

45
Zusammenfassung und Empfehlungen
Die Psychologie hat die Effektivität ihrer Interventionen in zahlreichen Grundlagen- und Anwendungsfeldern beeindruckend nachgewiesen Leider besteht noch immer die Gefahr ökonomisch bedeutsame Effekte durch Defizite der Forschungsmethodologien nicht zu entdecken Meta-Analyse-Techniken sind einer der größten Exportschlager der psychologischen Methoden geworden Kosten-Nutzen-Analysen sind auch für viele psychologische Interventionen realisierbar Ängste, bezüglich monetärer Effektivität erscheinen vollkommen unbegründet Wenden Sie die vorgeschlagenen Methoden in ihrem Anwendungsbereich an und sie werden erstaunt sein und sich fragen warum sie nicht schon längst solche Analysen durchgeführt haben.

Ähnliche Präsentationen


 András Bárdossy IWS Universität Stuttgart.>")

