Präsentation herunterladen
Die Präsentation wird geladen. Bitte warten

1
H:user/aig/vorlesungen/Linz_SS_2010/Linz_SS_2010_5.ppt Länderstrategien Irland, Schweden, Finnland Seminar LVA 239.231 Firmen und Märkte Karl Aiginger Dienstag, 13.4.2010, 10.15 – 12.00 K 269D und 13.15 – 15.15 UC6

2
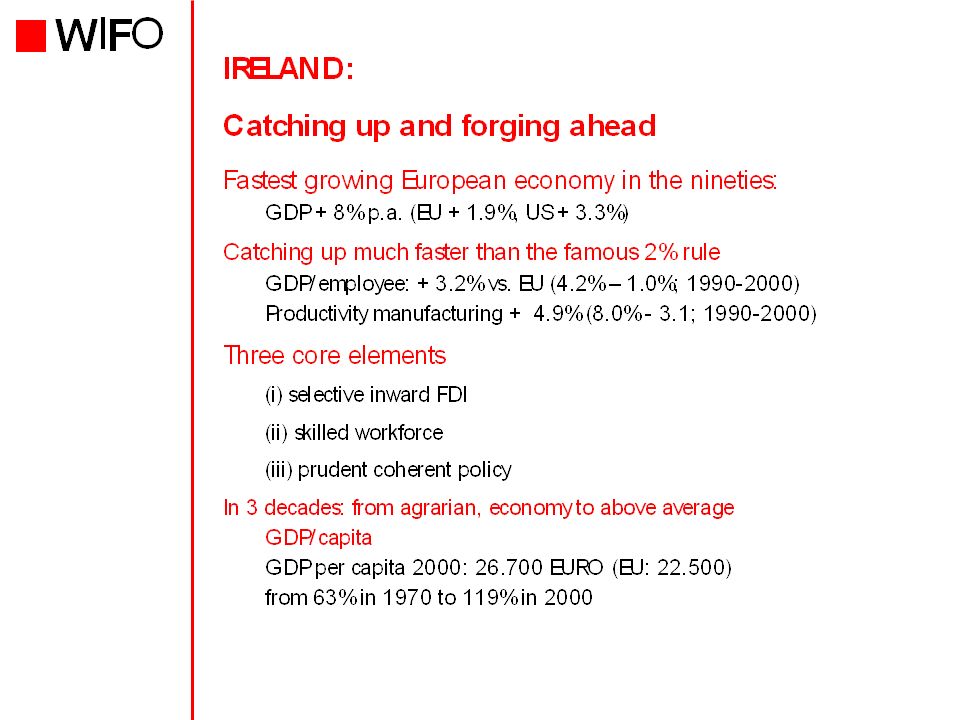
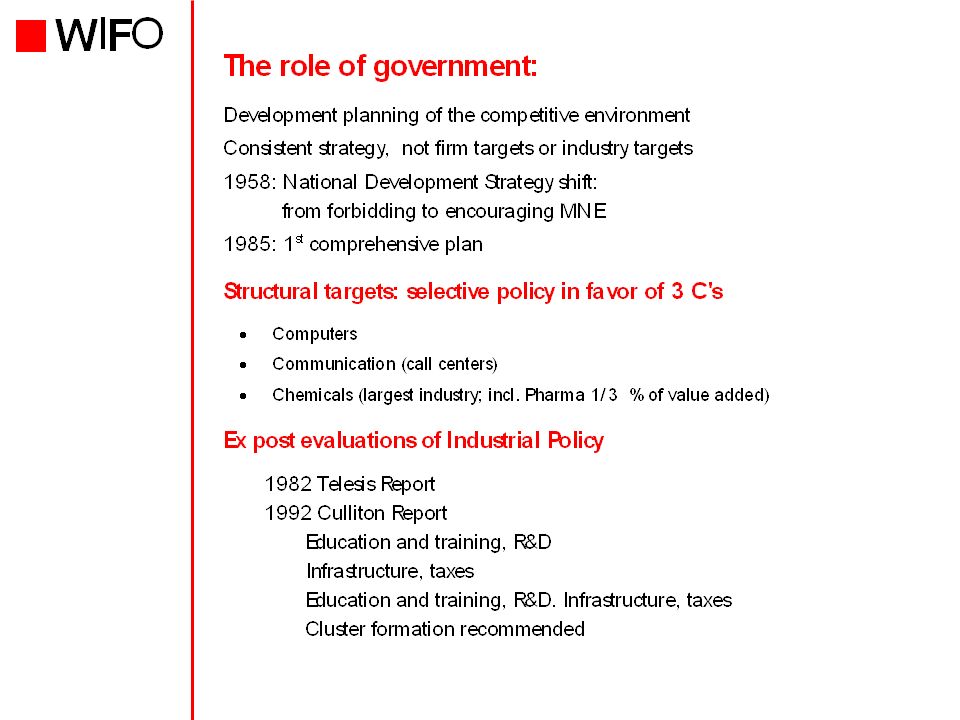
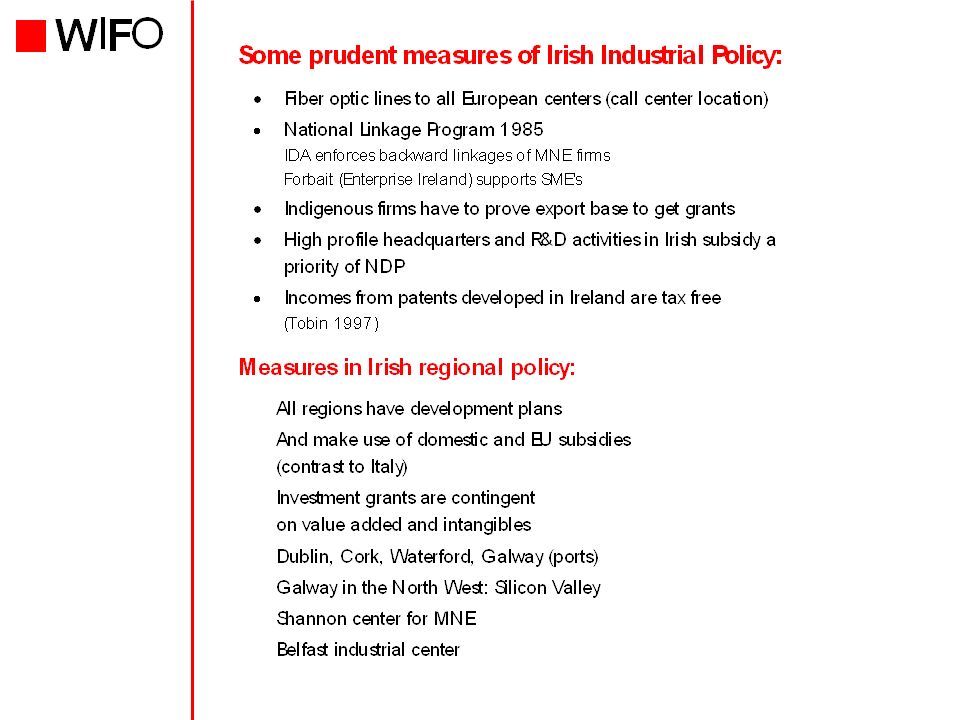
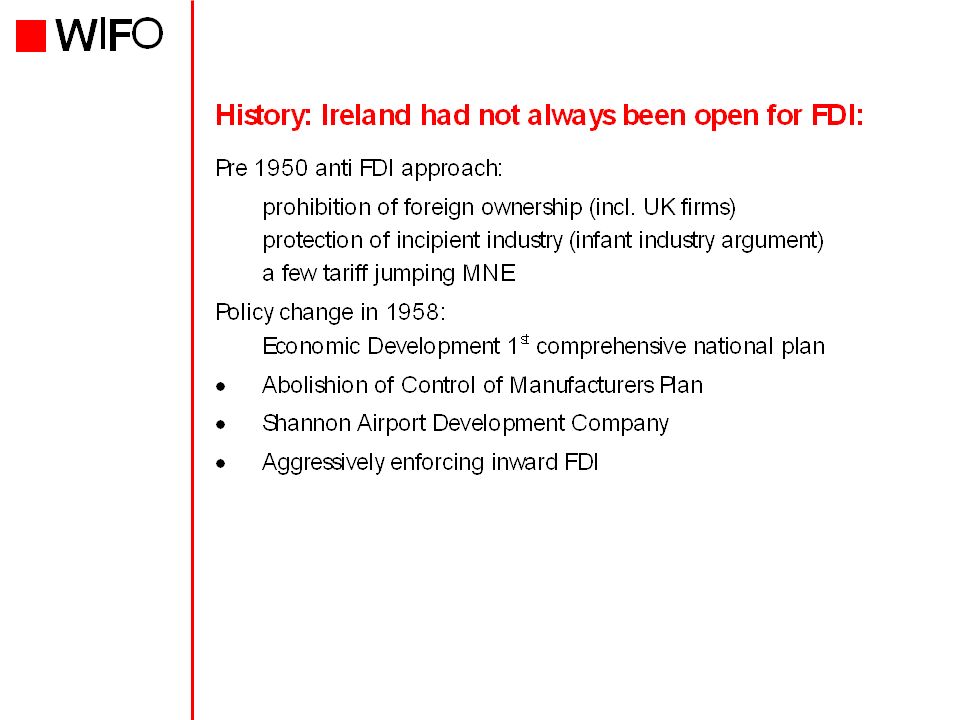
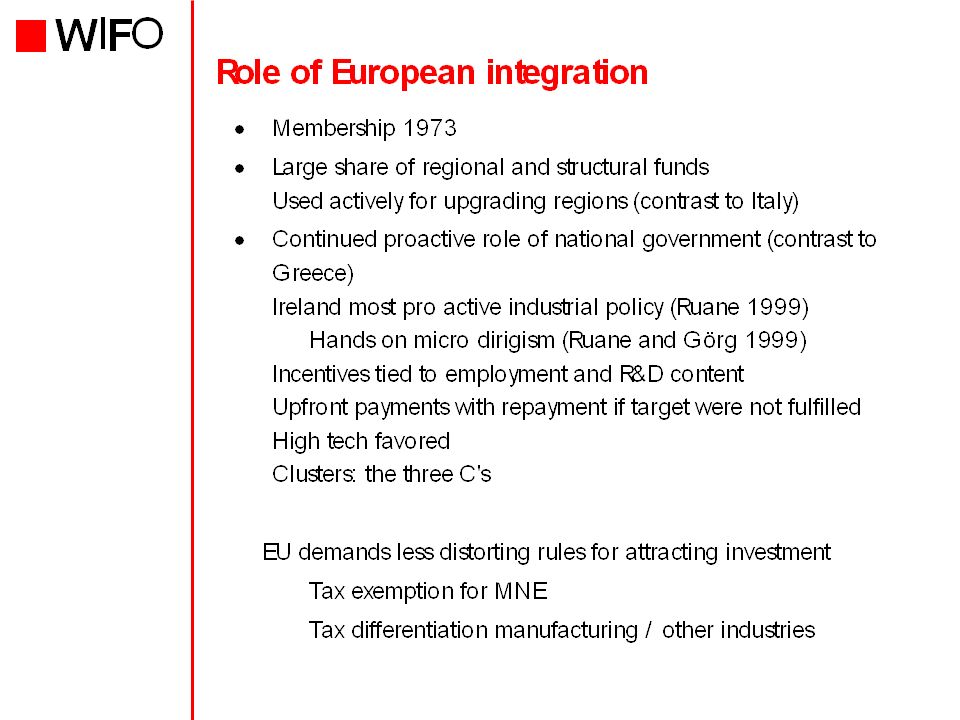
Irland Seminar LVA 239.231 Firmen und Märkte Karl Aiginger Dienstag, 13.4.2010, 10.15 – 12.00 K 269D und 13.15 – 15.15 UC6

22
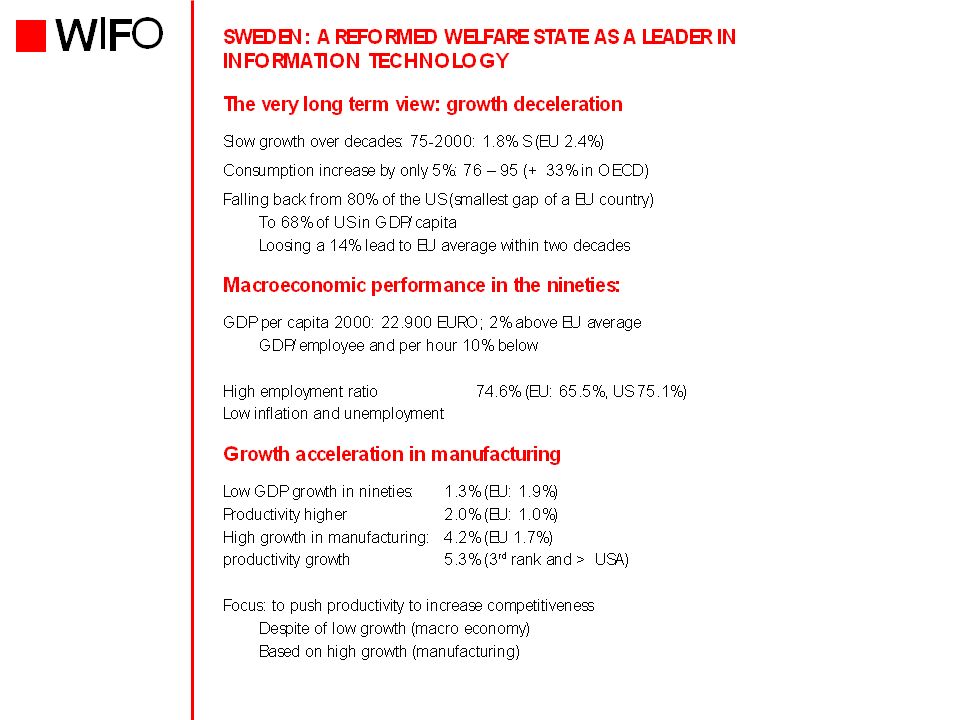
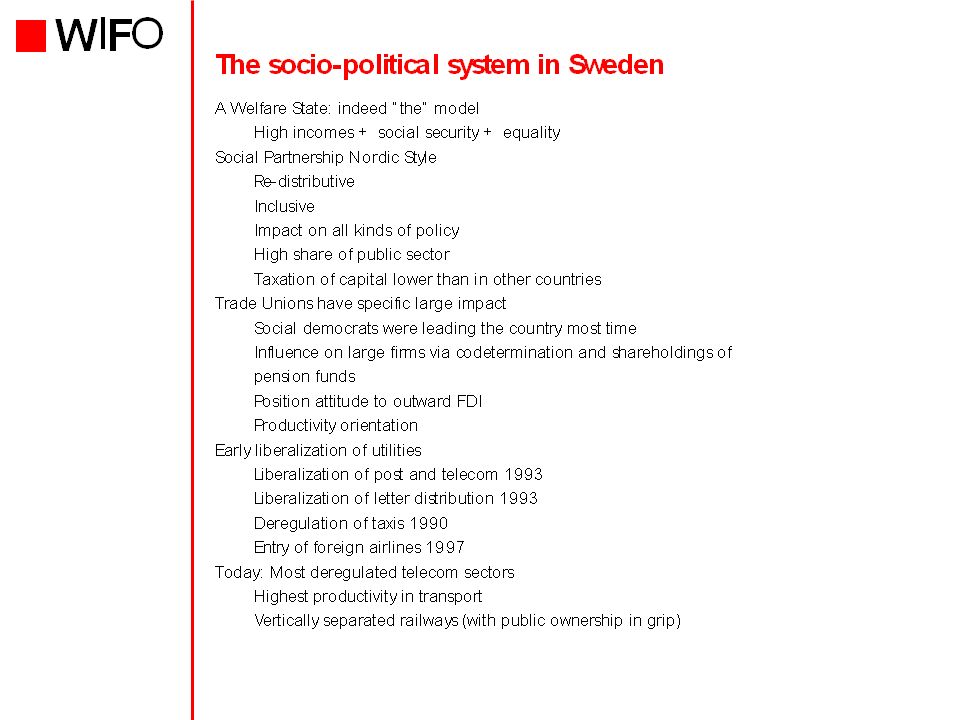
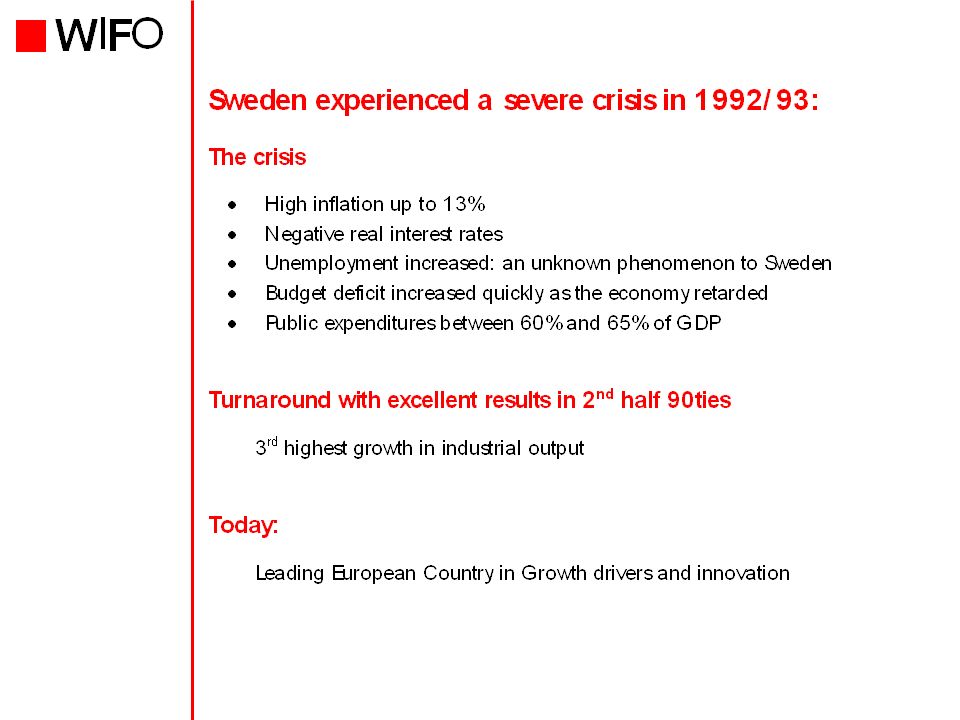
Schweden Seminar LVA 239.231 Firmen und Märkte Karl Aiginger Dienstag, 13.4.2010, 10.15 – 12.00 K 269D und 13.15 – 15.15 UC6

37
Figure 1m: Location and basic facts: Sweden

38
Figure 8b: GDP per capita at PPP in relation to the EU

39
Figure 8i: GDP per capita at PPP in relation to the EU

40
Figure 10b: GDP at 1995 market prices Growth rates (3 years moving average)
")
41
Figure 10i: Growth differences in real GDP of country vs. EU

42
Figure 11b: Taxes in % of GDP

43
Figure 12b: Government outlays in % of GDP

44
Figure 13b: Budget deficit/surplus in % of GDP

45
Figure 16b: Currency in relation to EURO Remark: A decrease in the line marks a devaluation of the currency relative to the EURO.

46
Figure 4: Macroeconomic performance: Sweden

47
Figure 5: Growth drivers: Sweden

48
Figure 6: Policy profiles: Sweden

49
Figure 7: Country profiles: Industry structure and quality position: Sweden

50
Figure 17m: The main industries: Sweden

51
Finnland Seminar LVA 239.231 Firmen und Märkte Karl Aiginger Dienstag, 13.4.2010, 10.15 – 12.00 K 269D und 13.15 – 15.15 UC6

60
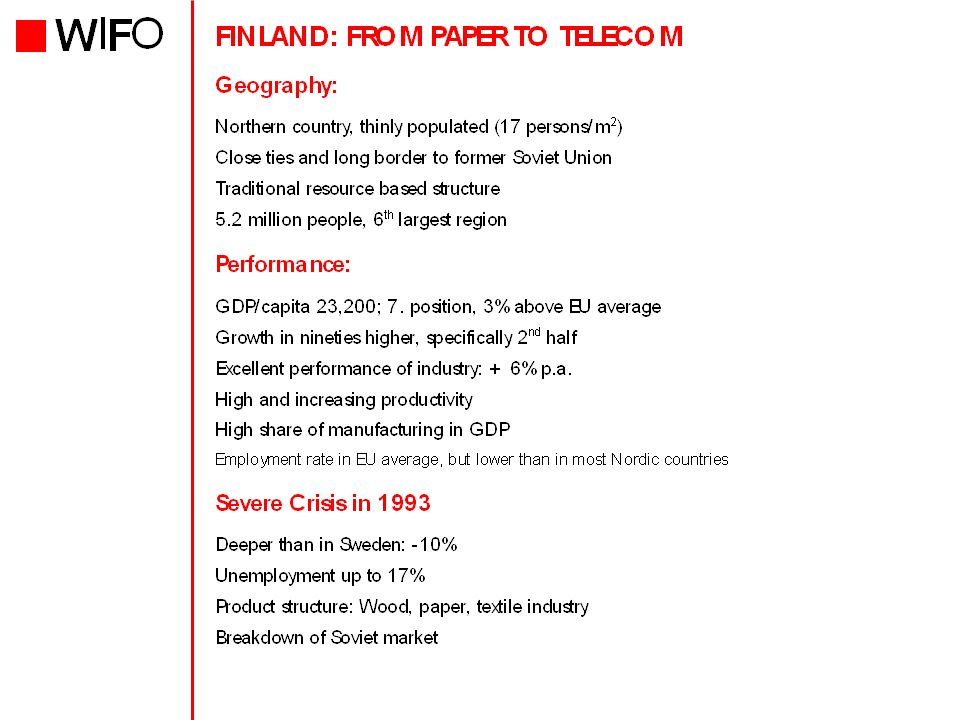
Figure 1l: Location and basic facts: Finland

61
Figure 4: Macroeconomic performance: Finland

62
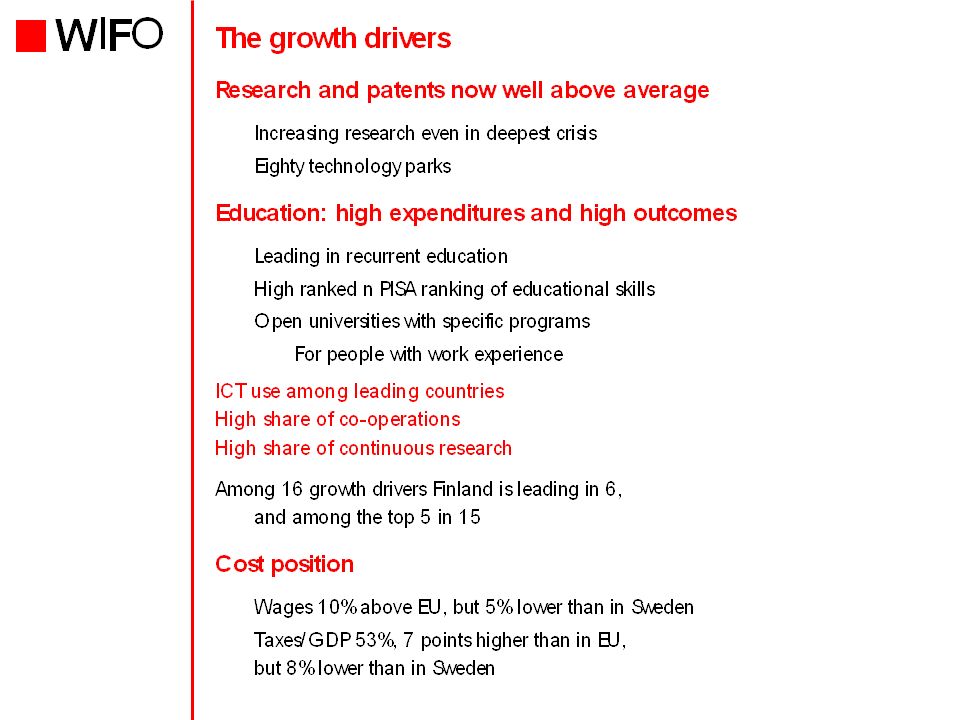
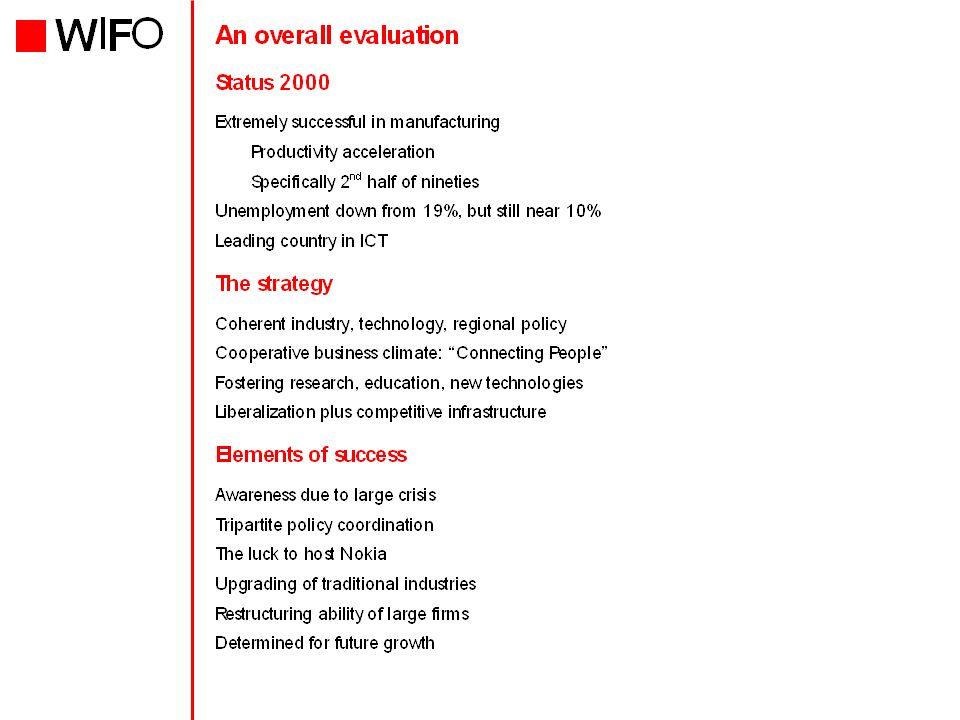
Figure 5: Growth drivers: Finland

63
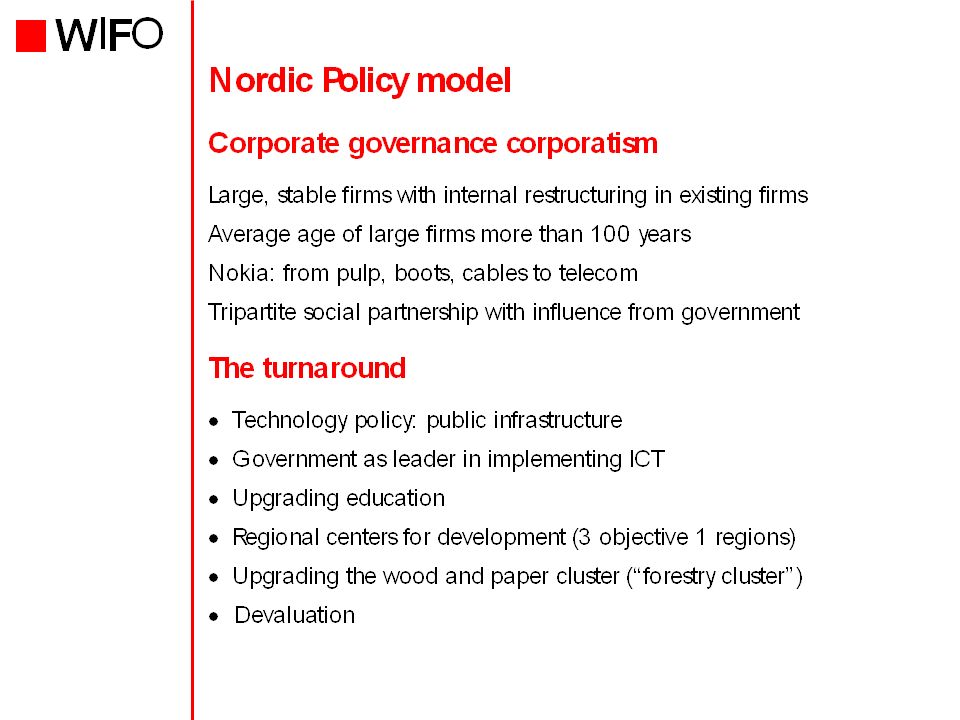
Figure 6: Policy profiles: Finland

64
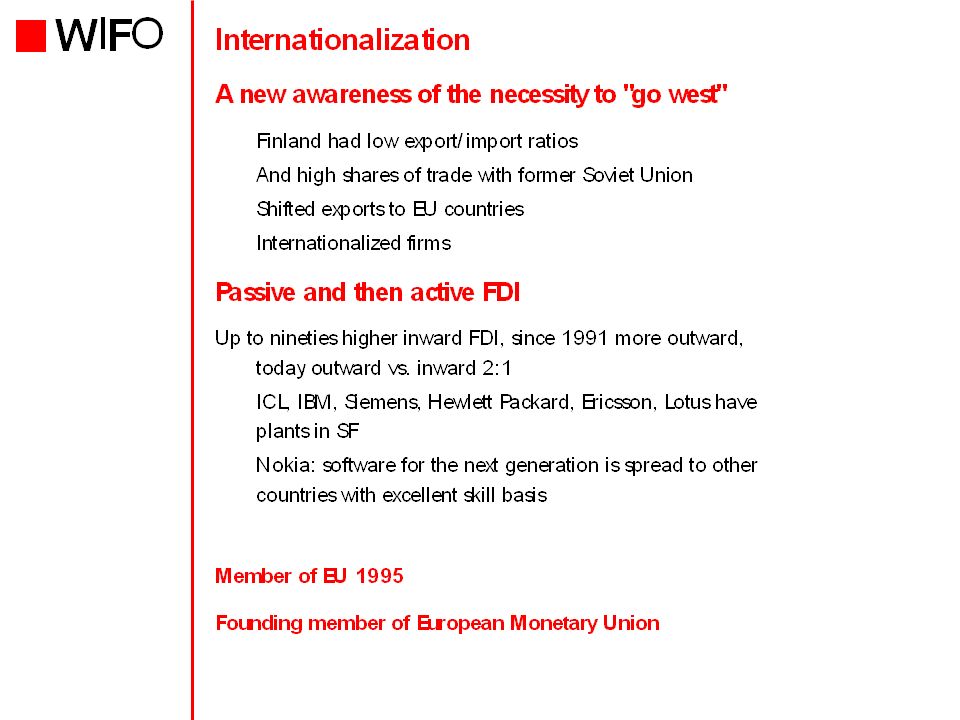
Figure 7: Country profiles: Industry structure and quality position: Finland

65
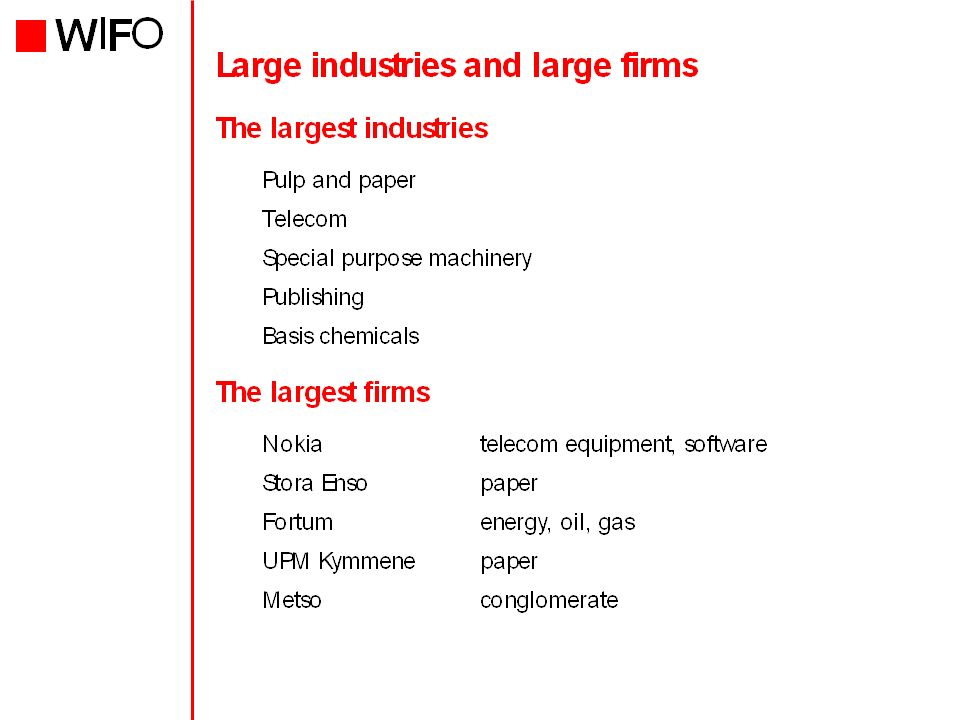
Figure 17l: The main industries: Finland

Ähnliche Präsentationen