Präsentation herunterladen
Die Präsentation wird geladen. Bitte warten

1
CHINA SHIPPING CONTAINER LINES
Krise vorbei - Business as usual ? Niels Harnack Geschäftsführer China Shipping Agency Germany 1

2
China Shipping Die Märkte Das Angebot Analyse Ausblick

3
The Story of China Shipping Group
China Shipping Group established in July 1997 as merger of three state owned smaller shipping enterprises. The Group’s ownership is 100 % State Group is Holding Company of China Shipping Container Lines, China Shipping Development and China Shipping Haisheng. Those three are partly listed at Hongkong and Shanghai Stock Exchange (since 2004) The Group’s Fleet consists of - Oil Tankers, Bulkers, Tramp vessels, Passenger Ships, Special Cargo Ships, River Barges, Container Ships - Total around 450 vessels / 12,5 million tons deadweight total - Thereof 158 Container vessels up to teus 3
 The Group’s Fleet consists of. - Oil Tankers, Bulkers, Tramp vessels, Passenger Ships, Special. Cargo Ships, River Barges, Container Ships. - Total around 450 vessels / 12,5 million tons deadweight total. - Thereof 158 Container vessels up to teus. 3.")
4
The Story of China Shipping Container Lines
Business activities in Europe started in March 1999 Today more than 350 offices in all continents More than 70 international major trade lanes and feeder routes Ranking among the world’s top 10 largest container carriers Managed and run as a privately owned company however not comparable with western procedures

5
Business Scope of China Shipping Group besides Shipping
Air : CS Air Freight Land : China Shipping Terminals, Intern. Forwarding, Warehousing, Distribution Others : CS Industry, CS Investment, CS Telecommunication

6
Die Märkte – Glaskugel oder verlässliche Hochrechnung
Markt erstaunlich robust – Welthandel plus 3,5% - Containervolumen plus 10% Erste Asien Pazifik Konferenz 1986 – Deutschland 2,8%, heute 13,6% China GPD 09 plus 8,7% - Forecast für 2010 über 10% Wachstum Chinesische Exporte innerhalb eines Jahrzehnts verfünffacht China´s Ex- und Importe Mai 09 / Mai 10 wertmäßig plus 50% USA leichte Erholung / Transpacific plus 28 % nur in diesem Jahr RMB Aufwertung Finanzkrise 3

7
China: BIP Wachstum gegenüber Vorjahresquartal
11,9 10,6 10,7 10,1 10,3 9,1 9 7,9 6,8 6,1 Quelle: HHR, Shanghai 3

8
China Exports to Key Destinations by Month 2008-2010
Quelle: Alphaliner Issue 37/2010 3

10
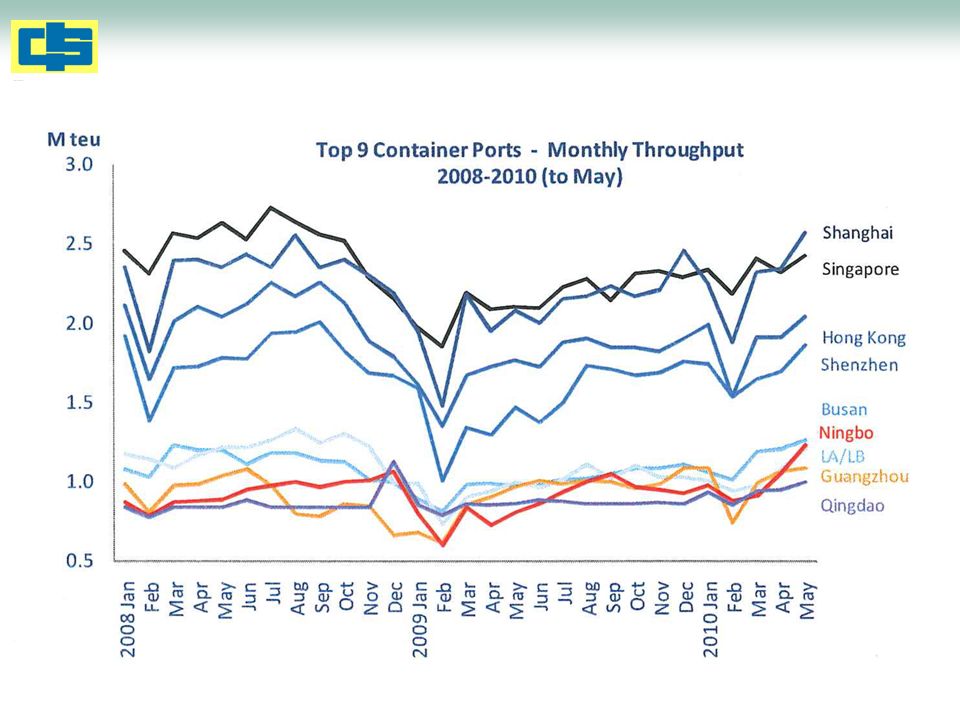
Top 20 Welt-Containerhäfen 1. Halbjahr 2009/2010
In 1000 TEU ** 6 Monate Veränd in % 1 2 3 4 5 6 7 8 9 10 Singapur Shanghai Hongkong Shenzhen Ports Pusan Ningbo-Zhoushan Guangzhou Qingdao Dubai Rotterdam 12.299 11.672 9.850 8.082 5.631 4.668 5.135 5.100 5.340 4.608 14.063 13.855 11.436 10.426 6.949 6.274 6.003 5.681 5.500 5.424 1.764 2.183 1.586 2.344 1.317 1.606 868 581 160 816 14,3 % 18,7 % 16,1 % 29,0 % 23,4 % 34,4 % 16,9 % 11,4 % 3,0 % 17,7 % 11 12 13 14 15 16 17 18 19 20 Tienjin Kaohsiung Port Kelang Antwerpen Hamburg Los Angeles Tanjung Pelepas Long Beach Xiamen Laem Chabang 4.161 4.051 3.331 3.615 3.550 3.186 2.730 2.333 2.134 2.163 4.707 4.553 4.307 4.200 3.703 3.664 3.156 2.795 2.738 2.522 546 502 976 585 153 478 426 462 604 359 13,1 % 12,4 % 29,3 % 16,2 % 4,3 % 15,0 % 15,6 % 19,8 % 28,3 % 16,6 % Top 10 72.387 85.612 13.225 18,3 % Top 20 18.317 ** TEU=Twenty Feet Equivalent Uni (Containereinheit)
")
11
Volumen - Entwicklung To Europe Growth 1H10 1H09 1H08 `10/ ‘09 TEU
Far East 20 % 6,454 5,357 6,879 North America 15 % 1,543 1,337 1,660 Australasia - 6 % 101 108 118 Middle East/ISC 18 % 874 738 817 Africa, Sub Saharan 5 % 314 299 312 Latin America 0 % 751 860 EastMed-N. Europe 13 % 421 371 400 7 Trades 17 % 10,458 8,961 11,045 (1,000 TEU)
")
12
All – in Frachten Basis 100/2008
To Europe April May June ` ‘09 ` ‘09 ` ‘09 Far East North America Australasia Middle East/ISC Africa, Sub Saharaan n/a n/a n/a n/a Latin America EastMed-N. Europe n/a

13
Volumen - Entwicklung From Europe Growth 1H10 1H09 1H08 `10/ ‘09 TEU
Far East 8 % 2,751 2,541 2,771 North America 12 % 1,356 1,207 1,779 Australasia 23 % 206 167 210 Middle East/ISC 9 % 1,293 1,186 1,214 Africa, Sub Saharan 6 % 547 514 526 Latin America 52 % 620 409 559 EastMed-N. Europe 19 % 579 485 502 7 Trades 13 % 7,352 6,509 7,562 (1,000 TEU)
")
14
All – in Frachten Basis 100/2008
From Europe April May June ` ‘09 ` ‘09 ` ‘09 Far East North America Australasia Middle East/ISC Africa, Sub Saharaan Latin America EastMed-N. Europe

15
Das Angebot - Fakten Aufliegertonnage von 11,3% im Jan gesunken auf unter 2% im Aug Gesamttonnage 2010 ytd plus 19% ( ex Auflieger plus Neubauten ) Neubauten: noch ca 150 Großcontainerschiffe über TEU on order für Ablieferung bis 2013, alleine 22 im 4. Q Im Juli höchste Anzahl Auslieferungen überhaupt Stellplatzkapazität insgesamt wächst jedoch langsamer Extrem junge Containerschiffsflotte Slow Steaming – 100 Containerschiffe weltweit - 4% der Gesamttonage 23 Fernostliniendienste / Woche im Januar gegenüber heute 30 21 Transpacificliniendienste / Woche Aug 2009 / ebenfalls 21 in Aug 2010 Container – Produktionsstopp seit Anfang 2009 2008 1,3 Mio TEU / TEU / ca 1,2 Mio TEU

16
Quelle: Alphaliner Issue 37/2010
Containership Fleet Capacity and Global Throughput Growth (F) Quelle: Alphaliner Issue 37/2010 3
 Quelle: Alphaliner Issue 37/")
17
Increase in active capacity by carrier
Jan 2010 vs Aug 2010 Quelle: Alphaliner Issue 35/2010 3

18
Idle containerships by size range
Quelle: Alphaliner Issue 35/2010 3

19
Wie weiter? Neubauten, die jetzt noch in den Auftragsbüchern stehen, werden kommen, verstärkte Orderaktivität für kurzfristige Ablieferungen. Total 25% der heutigen Gesamttonnage geordert. Equipment shortage in Asien und USA, hohe Leercontainerpositionskosten Markt schwächt sich leicht ab, Asiens Exporte minus 5 % im Aug Langsameres Volumenwachstum, anhaltender Kapazitätszufluss 2011 ca. 6 bis 8 % Increase aber 9,6 % zusätzliche Tonnage Slow steaming bleibt – environment – costs Frachtraten für Fernost und USA bleiben hoch obwohl unter Druck – Import mehr als Export Carrier werden extrem vorsichtig agieren müssen – Auflegen?

20
Shanghai Containerised Freight Index
Oct 2009 – Sept 2010 Quelle: Alphaliner Issue 37/2010 3

21
„Verschrottung“? – die Altersstruktur der Containerschiffsflotte
48% 21% 17% 6% 5% 4% Quelle: Clarkson Container Intelligience Monthly (März 2010)
")
22
Orderbook-to-Fleet Ratio 2000 - 2010
Quelle: Alphaliner Issue 37/2010 3

23
Gains/Loss in share prices
Between 1 Jan to 1 Jul 2010 1 OOIL 54% 2 YML 44% 3 HMM 40% 4 HJS 39% 5 KL 35% 6 CSAV 30% 7 Maersk 27% 8 EMC 22% 9 MOL 18% 10 NOL 16% 11 WHL 12 NYK 13% 13 CSCL 0% 14 COSCO -16%

Ähnliche Präsentationen


>")


Media Landesanstalt für Kommunikation Baden-Württemberg (LFK) Landeszentrale für Medien und Kommunikation.>")


