Präsentation herunterladen
Die Präsentation wird geladen. Bitte warten

1
Integration of large scale renewable energy into the grid
7th Inter-Parliamentary Meeting on Renewables Berlin, October 5th + 6th 2007 Integration of large scale renewable energy into the grid Ralf BISCHOF Managing Director German Wind Energy Association / Bundesverband WindEnergie (BWE)
")
2
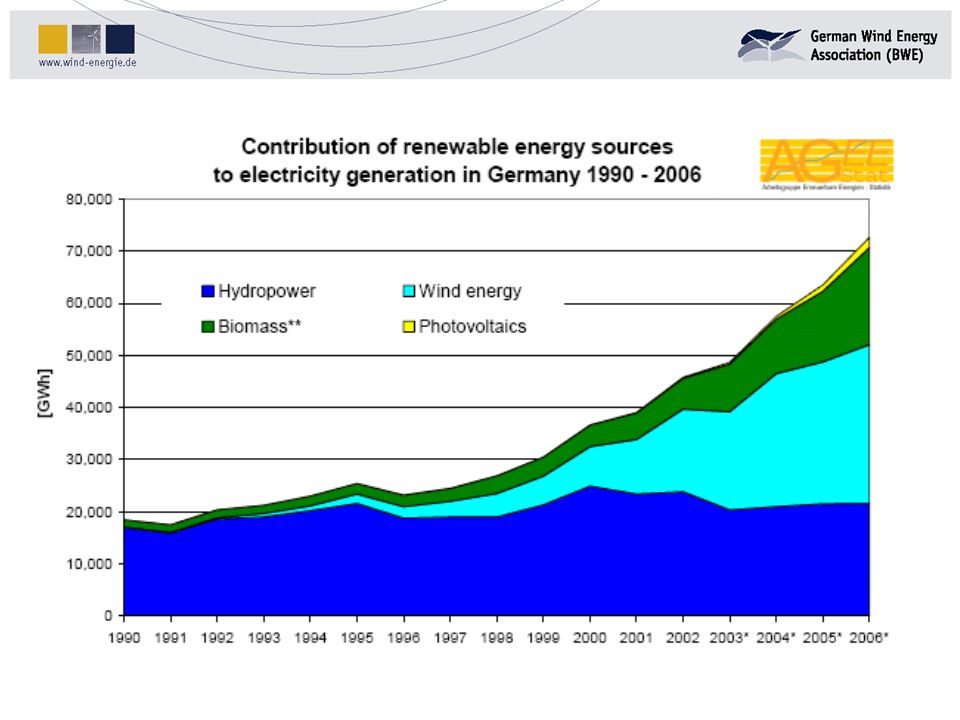
Example: Wind energy in Germany

3
Status quo 2006

4
Wind Energy in Germany – data end 2006
Installed capacity 20,622 MW Turbines 18,685 Electricity generation 35 billion kWh Share in gross electricity consumption 6.7% Employment 82,100 total value added 7.2 billion Euro Export rate 74 %

6
Wind energy in Europe: installed capacity

7
Target 2020

8
Target 2020 = 150 TWh/a = 36 TWh/a

9
Vorher Windpark Simonsberg (Schleswig-Hostein)
Nachher

10
Repowering Double capacity [MW] + tripple power [kWh]
![Repowering Double capacity [MW] + tripple power [kWh]](http://slideplayer.org/slide/960/1/images/10/Repowering+Double+capacity+%5BMW%5D+%2B+tripple+power+%5BkWh%5D.jpg "Repowering Double capacity [MW] + tripple power [kWh]")
11
Are 100% wind power feasible?
target: MW until 2020! Are 100% wind power feasible?

12
Yes! – 2006 in West-Denmark Quelle: DENA

13
Technology developemt – full load hours

14
Increase in capacity and efficiency: Development of turbine technology

15
Verbesserung der Erträge und Verstetigung – Beispiel I
Modellentwicklung eines deutschen Herstellers Alle Anlagen: 2.000 kW Nennleistung 98 m Nabenhöhe mittlere Windgeschwindigkeit 6,64 m/s (Durchschnitt) Rotordurch- Prototyp Ertrag Steigerung Volllast- messer aufgestellt p.a. stunden 70,4 m ,31 GWh/a h/a 71,0 m ,87 GWh/a + 13% h/a 82,0 m ,82 GWh/a + 35% h/a #
 Rotordurch- Prototyp Ertrag Steigerung Volllast- messer aufgestellt p.a. stunden. 70,4 m ,31 GWh/a h/a. 71,0 m ,87 GWh/a + 13% h/a. 82,0 m ,82 GWh/a + 35% h/a. #")
16
Verbesserung der Erträge und Verstetigung – Beispiel II
Zusätzlich am gleichen Standort mit 138 m Nabenhöhe: Rotordurch- Prototyp Ertrag Steigerung Volllast- messer aufgestellt p.a. stunden 82,0 m >6,5 GWh/a >+ 50% >3.250 h/a Nächste Schritt: 90 m Rotordurchmesser?

17
Die Entwicklung geht weiter ….
… 160 m Nabenhöhe in Laasow/Brandenburg

18
Die Entwicklung geht weiter ….
… Nabe einer 6-MW-Anlage mit 114 m Rotordurchmesser

19
Grid integration issues

20
General grid and system issues
Quelle: DENA

21
Relation between costs and benefits
Requirements for „low shares“ of wind energy in the system (WEC capacity < minimum system load) Requirements for “high shares” of wind energy in the systems (WEC capacity > minimum system load)
 Requirements for high shares of wind energy in the systems. (WEC capacity > minimum system load)")
22
Focus: Requirements for „low shares“ of wind energy in the system
System services can be provided by residual conventional power plants But some contributions of wind farms are indispensable already now Reactive power (decentral!) Congestions management (distribution level) Low voltage ride through = LVRT Reaction to disturbances (e.g. under-/overfrequency) … Some examples
 Congestions management (distribution level) Low voltage ride through = LVRT. Reaction to disturbances (e.g. under-/overfrequency) … Some examples.")
23
Simple reactive power requirement: limits for power factor
Stand: Germanischer Lloyd WindEnergie GmbH

24
Advanced requirement: reactive power – voltage regulation

25
LVRT: Grid code requirements for new (and old?) turbines
Quelle: DENA

26
Disturbance 4.11.2006: Overfrequency in North/East-UCTE

27
Disturbance 4.11.2006: Overfrequency in North/East-UCTE

28
Disturbance 4.11.2006: Reaction of WECs in E.on grid
Quelle: DENA

29
Grid capacity

30
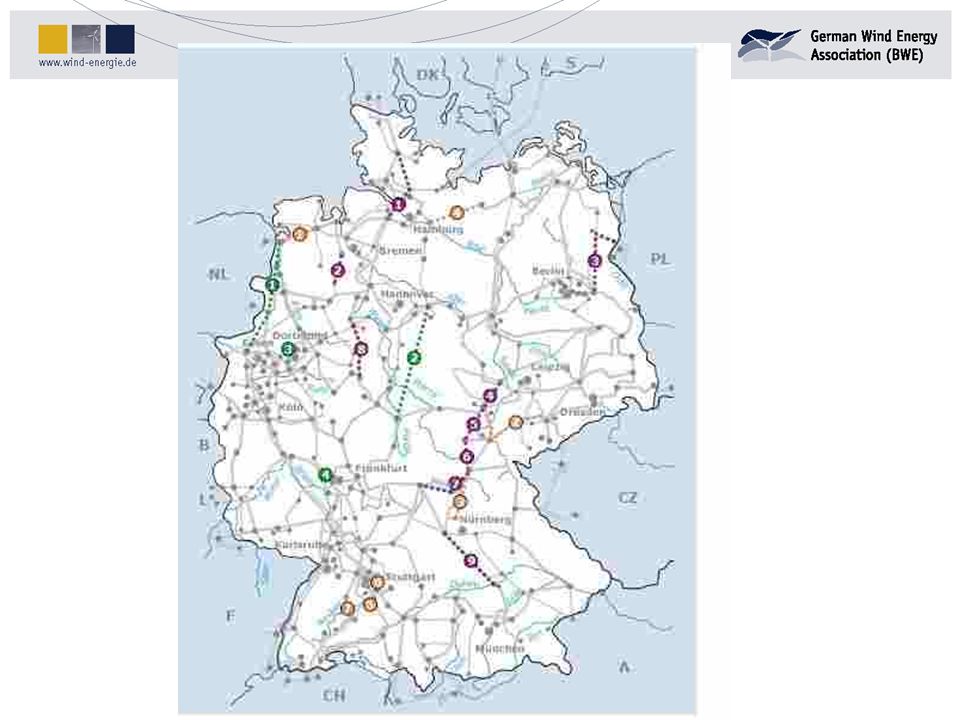
Grid integration – current issues in Germany
Production management already applied in some regions – grid expansion needs to happen more speedy Grid operators are obliged to expand grid In the meantime: demand for optimised use of grid, consideration of application of underground cable Example for optimised grid use through overhead-line monitoring: Depending on ambient temperature and wind speed increase of transmission capacity up to 50 % Only temperature: 1 % capacity per degree (ambient temperature / Celsius)
")
32
Netzausbau, Netz- und Erzeugungsmanagement
Strombelastbarkeit eines Freileitungsseiles mit und ohne Sonneneinstrahlung als Funktion der Umgebungs-temperatur bei erhöhter Windgeschwindig-keit (Queranströmung 1,8 m/s) blau: Einfluß der Umgebungs- temperatur rot: Einfluß der Sonnenein- strahlung
 blau: Einfluß der Umgebungs- temperatur. rot: Einfluß der Sonnenein- strahlung.")
33
High shares

34
Lastgang bei zunehmender Windeinspeisung

35
Lastgang bei zunehmender Windeinspeisung
Quelle: DENA

36
Lastgang bei zunehmender Windeinspeisung
Quelle: DENA

37
Lastgang bei zunehmender Windeinspeisung
Quelle: DENA

38
Ergebnis Mit zunehmenden Anteilen von Windstrom verschwindet der Bedarf an Grundlastkraftwerken Faustformel: MW Wind verdrängen MW Grundlast Detailuntersuchung: in Dena-Netzstudie

39
Dena-Netzstudie: Residuale Last im Jahr 2015
35,9 GW bzw. 77 TWh/a Wind (13,9% d. Verbrauchs) Stand: ~ 10 GW
 Stand: ~ 10 GW.")
40
Lastgang bei zunehmender Windeinspeisung
Quelle: DENA

41
What happens when the wind stops blowing?

42
Biogas Tagesspeicher

43
Plug-in-Hybrid

44
Biogas - Langzeitspeicher
In Deutschland gibt es Erdgasspeicher mit einem Volumen von 32,6 Mrd. Kubikmeter. Das Arbeitsvermögen entspricht über 80 Tagen Speicherkapazität.

45
Speicherwasserkraft in Skandinavien
Speicherinhalte (100%) Norwegen 84 TWh Schweden 34 TWh Finland 5 TWh Summe TWh = 3 Monate des deutschen Stromverbrauchs
 Norwegen 84 TWh. Schweden 34 TWh. Finland 5 TWh. Summe 123 TWh. = 3 Monate des deutschen Stromverbrauchs.")
46
Speicherwasserkraft im Nordpool
Stand: Quelle: 100% = 123 TWh

47
Stand:

48
Stand:

49
Stand:

50
Seekabel Kontinent - Skandinavien
Vorhanden 3 x West-Dänemark – Norwegen (Skagerrak), MW West-Dänemark – Schweden (Konti-Skan), 380 MW Deutschland - Ost-Dänemark (Kontek), 550 MW Deutschland – Schweden (Baltic), 450 MW Polen-Schweden (SwePol), 450 MW
, MW. West-Dänemark – Schweden (Konti-Skan), 380 MW. Deutschland - Ost-Dänemark (Kontek), 550 MW. Deutschland – Schweden (Baltic), 450 MW. Polen-Schweden (SwePol), 450 MW.")
51
Geplante Seekabel Kontinent - Skandinavien
2008: Niederlande – Norwegen (NorNed), 700 MW, 580 km, 550 m€ 2008+: West-Dänemark – Ost-Dänemark (Großer Belt), 600 MW 2011: Deutschland – Norwegen (NorGer - EWE/EGL/Agder/Lyse), 700 MW, 500 m€ 2012+: West-Dänemark – Norwegen (Skagerrak 4), 600 MW 201x: Deutschland – Schweden (Vattenfall), ??? MW
, 700 MW, 580 km, 550 m€ 2008+: West-Dänemark – Ost-Dänemark (Großer Belt), 600 MW. 2011: Deutschland – Norwegen (NorGer - EWE/EGL/Agder/Lyse), 700 MW, 500 m€ 2012+: West-Dänemark – Norwegen (Skagerrak 4), 600 MW. 201x: Deutschland – Schweden (Vattenfall), MW.")
52
Thank your for your attention!
Ralf Bischof German WindEnergy Association (BWE) Marienstraße 19-20 D Berlin Tel.: +49 / (0) Fax: +49 / (0) mailto:
 Marienstraße D Berlin. Tel.: +49 / (0) Fax: +49 / (0) mailto:")
Ähnliche Präsentationen