Präsentation herunterladen
Die Präsentation wird geladen. Bitte warten

1
Service Management mit NetIQ Lösungen
Der “IT Mehrwert” durch Service Management

2
Agenda Service Management – unumgänglich für IT Organisationen
Grundlagen Service Management Service Management und ITIL AppManager ControlCenter (Service Map Viewer) AppManagers Technik Q&A
 AppManagers Technik. Q&A.")
3
IT Herausforderungen & Trends
Benötigt Ausrichtung an Unternehmensziele Einhaltung Service Level Verpflichtungen Einfachstes Management der Komplexität Do More With Less proactiveres Arbeiten Übergabe “knowledge & best practices” Change Zukäufe, Mergers, Auflösungen Service Level Verpflichtungen Budget Konkurrenz Employees Customers Partners Verteilte Heterogene Umgebungen Outsourcing What we need to convey here is a level set for everyone. There will be new reps and experienced reps in the audiences and many of the new reps are still learning about what customers are facing. This slide will convey the challenges and trends and summarize the demands customers have these days. Distrib hetero env – many operating systems, many applications, many branch offices, many B2B and partner extranet types of communications – makes it complex and demanding Service Level Commitments – speak to both written and unwritten – most are unwritten and therefore impossible to achieve since every person will have a different perception of what the SLA is, regardless, it is all challenging Change – Add divisions, integrate companies, remove divisions, office and location moves, new branches, etc. Budget Competition – not only have budgets been static or decreasing, but business demands have increased. The demand for each budget dollar has increased in that more people and more businesses within the company want their priorities served and there is not enough to go around Outsourcing – Internal Development – The seemingly limitless power and speed of development with the new web services platforms makes it more palatable for companies to develop their own solutions rather than buy an off the shelf solution and spend a great deal of time/effort/$ customizing it. The problem comes in when these applications go into production since there are so many disparate parts to a web services application and at any time, one of the components can change or fail, causing a string of issues and operations has no idea how to detect this in the first place, how to know which end services are impacted by a component (element) failure, how to diagnose the issue, and how to get things back up and running and hopefully prevent a reoccurrence. Consolidation – This is a trend is some companies where they want a single enterprise solution – Many mid size companies are maturing to the point of wanting such a solution these days – The larger enterprises have typically made BoB purchases over the years and some like having them strung together as they do currently and some prefer a single enterprise solution. IT Maturity – you should know that spin Interne Entwicklung J2EE & .Net IT Organisations Abläufe Konsolidierung Best of Breed Single Enterprise solution
 failure, how to diagnose the issue, and how to get things back up and running and hopefully prevent a reoccurrence. Consolidation – This is a trend is some companies where they want a single enterprise solution – Many mid size companies are maturing to the point of wanting such a solution these days – The larger enterprises have typically made BoB purchases over the years and some like having them strung together as they do currently and some prefer a single enterprise solution. IT Maturity – you should know that spin. Interne. Entwicklung. J2EE & .Net. IT Organisations. Abläufe. Konsolidierung. Best of Breed. Single Enterprise solution.")
4
Service Management Es gehört einiges dazu um z. b
Service Management Es gehört einiges dazu um z.b. einen Messaging Service zu überwachen Buffer Attack Backup Anti Virus Content Mgmt BlackBerry Trojan Horse Firewall Administration Errors Firewall DNS SMTP Gateway UNIX / Linux IIS Security Sensor Misconfig Network Devices Sabotage End-User Experience Note: See at bottom for description of various security exposures/attacks…. So you think that managing an service is about managing Exchange, AD, DNS, and IIS? Well, think again (build). There are dozens of additional components, technologies, and organizational segmentations that must all be performing optimally in order for the service delivery SLA to be met. Anyone responsible for service delivery is going to be interested in the dependencies between the various components and the performance of each, as well as the end delivery and response time for the end user. Execs and remote employees demand access through blackberry. Salespeople access through outlook web access while remote. If the blackberry or IIS fail then to those users messaging is done…..etc. Not only are there many points of failure to be managed, there are security risks which may all impact service delivery as well and these security risks need to be mitigated in order to guarantee service delivery. If you are going to manage a service you need to be able to manage all the components, and report on the service as a single entity not a collection of nodes. You also need all of the administrators and people with their own views of the world to work together and not point fingers. Providing granular management for each admin as well as a comprehensive service management capability for the people actually responsible for the entire service delivery is critical to successful service management. Consider the security administrator and their focus on vulnerability management and security event management. Without them, service delivery could easily be impacted by an internal attack as a result of an unapproved privilege escalation or an external attack such as a denial of service attack that consumes firewall resources, bandwidth resources, and therefore reduces the throughput for everything else, including ! Now lets talk about our product vision to help you manage services like this across your enterprise. ================================ Security exposures explained IP Theft – Theft of company intellectual property Security Sensor Misconfiguration – Accidentally leaving ports open in a firewall, not updated the anti-virus application with the latest .dat files, failure to update the Intrusion Detection Sensor (IDS) with the latest attack profiles, failure to install anti-virus services on new servers or workstations Sabotage – When someone internal to the company leaves various holes open so they can attack later or when they set certain privileges, delete or alter data, crash an application on purpose, etc. Administration errors – Accidentally adding someone to a privileges group, accidentally shutting down an application, accidentally changing a setting in a key application – often occurs due to an accidental privilege escalation – the fewer people that have a lot of administration or powerful privileges, the better Buffer Attack – Directed at IIS (any web server actually, but in our example, IIS) (Outlook Web Access or some other web pages on the site are the target) – Attempt to pump in more data to a field than that field is supposed to handle and cause abnormal termination of application – often leaves user in “root” or in position of administrative authority so they can then do more destructive types of things…bottom line it impacts availability even if they don’t damage anything else Trojan Horse – Type of attachment to an (often an executable program) such that when that is opened or that program attached to an is run, the “trojan horse” gets control and comes alive to do its damage Exchange Active Directory Hardware & OS IP Theft
. There are dozens of additional components, technologies, and organizational segmentations that must all be performing optimally in order for the service delivery SLA to be met. Anyone responsible for service delivery is going to be interested in the dependencies between the various components and the performance of each, as well as the end delivery and response time for the end user. Execs and remote employees demand access through blackberry. Salespeople access through outlook web access while remote. If the blackberry or IIS fail then to those users messaging is done…..etc. Not only are there many points of failure to be managed, there are security risks which may all impact service delivery as well and these security risks need to be mitigated in order to guarantee service delivery. If you are going to manage a service you need to be able to manage all the components, and report on the service as a single entity not a collection of nodes. You also need all of the administrators and people with their own views of the world to work together and not point fingers. Providing granular management for each admin as well as a comprehensive service management capability for the people actually responsible for the entire service delivery is critical to successful service management. Consider the security administrator and their focus on vulnerability management and security event management. Without them, service delivery could easily be impacted by an internal attack as a result of an unapproved privilege escalation or an external attack such as a denial of service attack that consumes firewall resources, bandwidth resources, and therefore reduces the throughput for everything else, including ! Now lets talk about our product vision to help you manage services like this across your enterprise. ================================ Security exposures explained. IP Theft – Theft of company intellectual property. Security Sensor Misconfiguration – Accidentally leaving ports open in a firewall, not updated the anti-virus application with the latest .dat files, failure to update the Intrusion Detection Sensor (IDS) with the latest attack profiles, failure to install anti-virus services on new servers or workstations. Sabotage – When someone internal to the company leaves various holes open so they can attack later or when they set certain privileges, delete or alter data, crash an application on purpose, etc. Administration errors – Accidentally adding someone to a privileges group, accidentally shutting down an application, accidentally changing a setting in a key application – often occurs due to an accidental privilege escalation – the fewer people that have a lot of administration or powerful privileges, the better. Buffer Attack – Directed at IIS (any web server actually, but in our example, IIS) (Outlook Web Access or some other web pages on the site are the target) – Attempt to pump in more data to a field than that field is supposed to handle and cause abnormal termination of application – often leaves user in root or in position of administrative authority so they can then do more destructive types of things…bottom line it impacts availability even if they don’t damage anything else. Trojan Horse – Type of attachment to an (often an executable program) such that when that is opened or that program attached to an is run, the trojan horse gets control and comes alive to do its damage. Exchange. Active. Directory. Hardware. & OS. IP Theft.")
5
Service Management Sichtweisen
Web-basierte Applikation Service Sicht Management einer Service Metrik (z.B. response time, Verfügbarkeit) Application Servers: Multi-vendor Multi-vendor Network: Web Servers: Multi-vendor Databases: Multi-vendor Service Management: Relevante Service Metriken zum Infrastruktur Verhalten Here we see the web-based application that sits on top of the infrastructure. The service view measures metrics that are important to the user (such as response time, and application uptime). The service and element monitoring views provide very different perspectives on operation of the application. For example, the Web Server, Application Server, and Database Server may each be slightly off regular performance, and not exceed an alert threshold. However, in combination, there may be a significant degradation of user response time. Without a service view, the system may appear to operate properly to the IT group, while in fact users are having significant issues. Service Management enables IT to relate service metrics to the behavior of the infrastructure to determine the cause of problems and appropriate corrective actions. Management einer Vielzahl von Heterogenen Komponenten: (Network, Web Servers, App Servers, Databases) Netzwerk Admin Web Admin System Admin Databank Admin
 Application Servers: Multi-vendor. Multi-vendor. Network: Web Servers: Multi-vendor. Databases: Multi-vendor. Service Management: Relevante Service Metriken. zum Infrastruktur Verhalten. Here we see the web-based application that sits on top of the infrastructure. The service view measures metrics that are important to the user (such as response time, and application uptime). The service and element monitoring views provide very different perspectives on operation of the application. For example, the Web Server, Application Server, and Database Server may each be slightly off regular performance, and not exceed an alert threshold. However, in combination, there may be a significant degradation of user response time. Without a service view, the system may appear to operate properly to the IT group, while in fact users are having significant issues. Service Management enables IT to relate service metrics to the behavior of the infrastructure to determine the cause of problems and appropriate corrective actions. Management einer Vielzahl von. Heterogenen Komponenten: (Network, Web Servers, App Servers, Databases) Netzwerk Admin. Web Admin. System. Admin. Databank. Admin.")
6
Vergleich von Metriken
CPU load Memory utilization Available disk Process monitoring Etc… Traditionelle Monitoring Metrik Application availability User response time Incident response time Max. duration for outage Etc… Service Management Metrik Another way to illustrate the difference between element monitoring and service management is to look at the metrics in each scenario: Traditional monitoring looks at device performance metrics like cpu, disk, memory, etc. Service management looks at metrics that are relevant to the user: response time, how quickly IT responds to reported problems, etc. In many cases, bonuses of IT personnel are tied to meeting service level metrics. The reality is that both types of metrics are needed for effective Systems Management.

7
NetIQ Vision Service Management Lebenszyklus
Service Level Reports & Sichtweisen Verfügbarkeits Analysen Erwartungen identifiz… Pläne zur Verbesserung Review Ermitteln der Business Anforderungen Einrichten von baselines & Ressourcen Erweitern der Service Angebote Assess SLA Service Maps Monitoring Policies Define Monitor, Priorisierung, Benachrichtigungen, Antworten Automatismus für Effizienz and Genauigkeit Diagnose & Lösung root cause Operate We have a vision around addressing the pain in managing service delivery of key business services such as , VoIP, Web Services. There is a lifecycle that exists and seems fairly simple when one considers the logical steps involved. The lifecycle is a never ending process for which the steps do not change, rather the tasks or activities at each step change as the organization matures. Assess – IT must know what the business requirements are, must be able to determine current capabilities and gaps, and must be sure that commitments to SLAs can be met or that gaps can be addressed Define – Creating the SLAs themselves, linking the components that make up the service, and creating the monitoring policies that in the end will define the service Operate – IT must monitor the components that comprise the service, prioritize incidents that occur, notify key personnel to respond to issues, perform the initial diagnostics and determine the root cause, and hopefully automate as much of this as possible Review – Service level reports and views of service performance and overall availability analysis internal to IT to ensure that service delivery commitments are achieved, including identification of exceptions and improvement plans to address exceptions NetIQ AppManager Suite addresses all areas of the cycle in varying degrees as the following slide shows.

8
AppManager Suite Umfassendes Service Management
Forschrittliches Service Level Reporting und Interaktive Analysen mit AppManager Analysis Center Review Assess Operate Define Zentralisiertes Service Management mit dem AppManager Control Center mit AppManager Diagnostic Console Troubleshooting und Root-Cause Isolierung The AppManager suite delivers service management functionality today. The capabilities of each of the major components builds here and shows how NetIQ delivers in each phase of the lifecycle. For a comprehensive lifecycle description, see below. Centralized Service Management with AppManager Control Center Simplify the monitoring environment with visual correlations Centralize monitoring policy and exception management Proactive Operational Management with AppManager 6.0 Simplify the monitoring of key services and identification of exceptions Retain and share knowledge Troubleshooting and Root-Cause Isolation with AppManager Diagnostic Console Supports Windows and Exchange Leverages & Extends AppManager The Lifecycle: Assess Your Environment The assessment phase determines requirements, existing capabilities and how these service capabilities can be extended. It entails several specific activities: Determination of business requirements Establishment of service level baselines Assessment of IT capabilities Determination of how to extend service offerings With AppManager Analysis Center for advanced reporting capabilities, you can turn data into actionable knowledge to more effectively manage services, business/infrastructure applications and elements. This allows you to provide efficient data collection; rapidly generate reports; and deliver service-level compliance, capacity planning and historical trending. Define Your Service Level Requirements This phase focuses on defining specific service management requirements and translating these into specific policies for monitoring and management: Define SLA content - SL Objectives - SL Indicators - Service Hours - Customer information, etc. Map to Underlying Operational Procedures With AppManager Control Center’s flexible and powerful console, you gain innovative ways for users to document and correlate their IT assets to business services. This allows you to efficiently manage large server environments; streamline functions for processing large numbers of alerts and events; and view your IT environment in an applications and business service context. Operate More Efficiently The primary activities at this phase are centered on operating the IT environment so as to meet or exceed the defined service level metrics. The important functions here are to: Monitor the infrastructure and prioritize issues to be addressed Provide notification of problem issues and facilitate appropriate responses Automate the process of detecting problems and taking corrective actions Assist in the resolution of problems. The core AppManager product enables you to monitor and manage your business applications, services and IT infrastructure, allowing you to centrally manage the health, performance and availability of more than 60 popular server applications across Windows, UNIX and Linux systems. You can also scale AppManager's robust and flexible architecture to thousands of servers and customize your solution without having to learn proprietary languages or technologies with AppManager's use of industry-standard technologies, such as XML, VBA, Perl and Java. Review and Relate Data The review phase completes the service management lifecycle. Main activities here are to: Create service level reports and views. Analyze service availability Identification service level exceptions Develop plans to correct issues. With AppManager Diagnostic Console, you have the capability to remotely diagnose and resolve common problems in Windows and Exchange, improving IT efficiency and reducing application downtime. This allows you to integrate with AppManager for the automated collection of relevant diagnostic information; collect data through several mechanisms, such as AppManager agents, NetIQ Performance Endpoints and WMI; and relate application/business service issues with problems in the underlying IT infrastructure. Proaktives Operation Management mit AppManager 6.0 und AppManager Performance Profiler

9
Aktuelle Position – Windows Market
Marktführer im Microsoft Technologie Management Mehr als das doppelte an Marktanteilen (Gartner Dataquest’s October 2003 report NSM Market Statistics and Vendor Shares)
")
10
Überblick Service Management und ITIL

11
Was ist das Ziel hinter dem Service Management
Reduzierung Kosten IT unterstützt den “Firmen Business Prozess” IT Organisation als Service Provider Systematisches Erreichen der IT Prozesse Business-like Verhältnis zwischen IT und deren Kunden Verbesserte Kommunikation zwischen Geschäftsinteressenten IT-Kunden, IT-Usern und den IT Organisationen Meßbarer Beitrag zum Geschäftserfolg durch wirkungsvolle und leistungsfähige IT Prozesse

12
Probleme ohne Service Management
Mangel an Transparenz für Services fehlende, unvollständige oder ungenaue Service Level Vereinbarungen Mangel an Kommunikation zwischen IT und deren Kunden Service Qualität kann nicht nachgewiesen werden (keine messbaren Kriterien) Kein umfassendes Verständnis, was für Komponenten ein Service umfasst Oft ineffiziente interne Prozesse
 Kein umfassendes Verständnis, was für Komponenten ein Service umfasst. Oft ineffiziente interne Prozesse.")
13
Was ist ITIL IT Infrastructure Library (ITIL) Buchserie
Publiziert bei dem British Office of Government Commerce (OGC) Entwickelt bei Central Computer and Telecommunication Agency (CCTA) Ende der 80iger Jahre De-facto Standart in IT Service Management (ITSM) Jedes Buch beschreibt: einen IT Prozess dessen Rolle Funktion Abhängigkeiten Es ist kein fertiges Set von Regel Es ist eine flexible best practice Annäherung und ein offenes Framework
 Entwickelt bei Central Computer and Telecommunication Agency (CCTA) Ende der 80iger Jahre. De-facto Standart in IT Service Management (ITSM) Jedes Buch beschreibt: einen IT Prozess. dessen Rolle. Funktion. Abhängigkeiten. Es ist kein fertiges Set von Regel. Es ist eine flexible best practice Annäherung und ein offenes Framework.")
14
Andere Standards MOF: Microsoft‘s Adaption von ITIL
ISO 9001: Qualitäts Management TQM: Enterprise-wide Qualitäts Management SIxSigma: Qualitäts Management aus Sicht der „Produktionsbrille“ GAMP 4: Qualitäts Management für Pharmaceutica Cobit: Auditing von IT Prozessen Prince 2: Project Management für die ITIL Implementation

15
Grundlegende Gedanken um SLA‘s
“Was Sie nicht beeinflussen können, sollten Sie nicht messen” “Was Sie nicht messen können, können Sie auch nicht managen” “Was Sie nicht managen können, Sollten Sie nicht in einem SLA festlegen”

16
Die Landschaft des Service Management’s
Catalog Services Service Level Requirements SLA/OLA/ Underpinning Contracts Monitor/Report/Review Availability Requirements Design for availability & recoverability Security Policy Measure & Report Model & Size Monitor & Analyze Tuning Demand Management Business Impact Analysis Risk Assessment High Availability Measures Backup & Recovery Attribute costs to services delivered Budgeting, Charging IT Accounting Service Level Management Availability Management Capacity Management Continuity Management Financial Management Service Desk Track Incidents & Changes Operational Tasks Supplier Liaison Customer Liaison Service Delivery Service Support Incident Management Problem Management Configuration Management Change Management Release Management Detect or Notice Record, Classify & Match to Problems Notify, Triage, Assign Investigate & Diagnose Resolve & Recover Incident Analysis Identify Root Cause Preventive actions & fixes (changes) Record problem knowledge Identify, record, track IT components (CMDB) Define standards & capture baselines Monitor/Report on changes Request, Analyze, Approve Changes Test effect of change Implement change Monitor effects of change and review Plan, Design and Build release Testing & Release acceptance Implement rollout Communicate & Train
 Record problem knowledge. Identify, record, track IT components (CMDB) Define standards & capture baselines. Monitor/Report on changes. Request, Analyze, Approve Changes. Test effect of change. Implement change. Monitor effects of change and review. Plan, Design and Build release. Testing & Release acceptance. Implement rollout. Communicate & Train.")
17
Messaging Beispiel Service Delivery Service Support
Ensure that Messaging service quality is measured and delivered at the level required by the business and its customers Figure out how to Prevent, Respond to and Report on Messaging outages in a cost-effective way; Secure the Messaging service Make sure there’s enough storage space for everyone’s , and that quotas are set appropriately Perform nightly backups of Exchange data and recover in a timely fashion after disaster Understand, Control and Budget for the cost of the Messaging service Service Level Management Availability Management Capacity Management Continuity Management Financial Management Service Desk Track Exchange outage and perform recovery tasks; Restore Exchange mailboxes; Track service upgrades Service Delivery Service Support Incident Management Problem Management Configuration Management Change Management Release Management Detect that Exchange went down, and getting it back online. Figure out that Exchange goes down too often for the same reason, and identify a permanent fix. Record and track which components make up the Messaging service Request, Approve and Implement the fix identified by problem management (or a new release, identified by Release Mgmt) Design, Engineer and Test an upgrade from Exchange 5.5 to Exchange 2003
 Design, Engineer and Test an upgrade from Exchange 5.5 to Exchange")
18
Was für Bereiche spricht NetIQ an?
Drives Participates Feeds Drives Participates Feeds Drives Participates Feeds Drives Participates Feeds Drives Participates Feeds Measure service levels (AM-RT); Report on service levels (AC) Report availability trends & downtime history (AC); Define & enforce security policies (VM; SM; VPC; DRA) Measure capacity utilization (AM); Calculate aggregate workload (AMPP); Report on capacity trends (AC) Monitor backup software & alert on failure (AM) N/A Service Level Management Availability Management Capacity Management Continuity Management Financial Management Service Desk Create tickets via connectors Drives Participates Feeds Incident Management Problem Management Configuration Management Change Management Release Management Detect problems in IT components (AM); Diagnose & recover from failures (AMDC; AM) Report on incident & performance trends (AM; AC); Supply diagnostic details to aid in root cause analysis (AM; AMDC) Detect & report on component configuration (VM; AM); Report on Group Policy (GPA) Analyze, implement & audit changes to Group Policy (GPA; GPG) N/A Drives Participates Feeds Drives Participates Feeds Drives Participates Feeds Drives Participates Feeds Drives Participates Feeds
; Report on service levels (AC) Report availability trends & downtime history (AC); Define & enforce security policies (VM; SM; VPC; DRA) Measure capacity utilization (AM); Calculate aggregate workload (AMPP); Report on capacity trends (AC) Monitor backup software & alert on failure (AM) N/A. Service Level Management. Availability Management. Capacity Management. Continuity Management. Financial Management. Service. Desk. Create tickets via connectors. Drives. Participates. Feeds. Incident Management. Problem Management. Configuration Management. Change Management. Release Management. Detect problems in IT components (AM); Diagnose & recover from failures (AMDC; AM) Report on incident & performance trends (AM; AC); Supply diagnostic details to aid in root cause analysis (AM; AMDC) Detect & report on component configuration (VM; AM); Report on Group Policy (GPA) Analyze, implement & audit changes to Group Policy (GPA; GPG) N/A. Drives. Participates. Feeds. Drives. Participates. Feeds. Drives. Participates. Feeds. Drives. Participates. Feeds. Drives. Participates. Feeds.")
19
Zusammenfassung Service-Managementfähigkeit ist eine wesentliche Kompetenz für IT Organisationen NetIQ hat einen einzigartigen Satz von Service-Managementlösungen: Platformen: Windows, UNIX, Linux Tiefe Fachkenntnisse in Applikationen Proaktives Monitoring Service-level Reporting Diagnosen Fähigkeit, beschlossene Service Level Metriken zu erreichen IT erhöht die Personal-Leistungsfähigkeit (Mitarbeiter können sich mehr zukunftsorientierten Aufgaben widmen)
")
20
AppManager, wie sieht er nun aus
?
21
AppManager und das Service Management
Diagnostics Console 2.0 Control Center 1.0 Service Map Viewer Analysis Center 2.0 Knowledge Base Dynamic Threshold Management

22
NetIQ AppManager Diagnostic Console
Die AppManager Diagnostic Console ist die diagnostische Erweiterung der System Management Lösung von NetIQ. Mit ihrer übersichtlichen und intuitiven Oberfläche hilft die Konsole schnell und einfach Probleme und Engpässe live am System zu erkennen.

23
NetIQ AppManager Diagnostic Console
Die AppManager Diagnostic Console hilft ihnen bei … der Echtzeitdarstellung aller Performancewerte der Fehlersuche und Analyse der Findung von lokalen Engpässen der täglichen Administration und vieles mehr…

24
NetIQ AppManager Diagnostic Console
AppManager Diagnostic Console Features: remoter Zugriff über WMI oder den AppManager moderne und intuitive Oberfläche Firewall tauglich Antwortzeitmessung durch End-to-End Technologie und vieles mehr…

25
NetIQ AppManager Diagnostic Console
AppManager Diagnostic Console unterstützt: Windows Betriebssysteme CPU, Memory, Disk, Netzwerk, Dienste, Prozesse, … Microsoft Active Directory Replication, Warteschlangen, Fehler, … Microsoft Exchange Warteschlangen, Durchsatz, Statistik, …

26
Diagnostic Console 2.0 Was ist der Mehrwert für Sie als Kunden?
NetIQ’s erweiterte Darstellungen Verbessert IT Effizienz bei eingeführten Applikationen Reduziert die Downtime, Mitarbeiter finden schneller Lösungen Problem tritt ein Problem entdeckt Admin verständigt Problem lösen Wiederaufnahme komplett anschließende Analyse Zeit bis zur Entdeckung AM Automatisierte Aktionen… AM liefert unabkömmliche Information… AppManagers reduziert erheblich die Reaktionszeit Analysis Center Knowledgebase AMDC reduziert erheblich den Zeitfaktor “Problemfindung “

27
Diagnostic Console 2.0 NetIQ Confidential Status of storage groups
Mailboxes Public folders Transaction logs Send/receive requests CPU and memory usage NetIQ Confidential

28
Diagnostic Console 2.0 Beispiel: Exchange
Performance Summary Key Health Indicators Status of storage groups Mailboxes Public folders Transaction logs Send/receive requests CPU and memory usage

29
Diagnostic Console 2.0 Beispiel: Active Directory

30
AppManager 6 Wave Diagnostics Console 2.0
Control Center 1.0, Service Map Viewer Analysis Center 2.0 Knowledge Base Dynamic Threshold Management

31
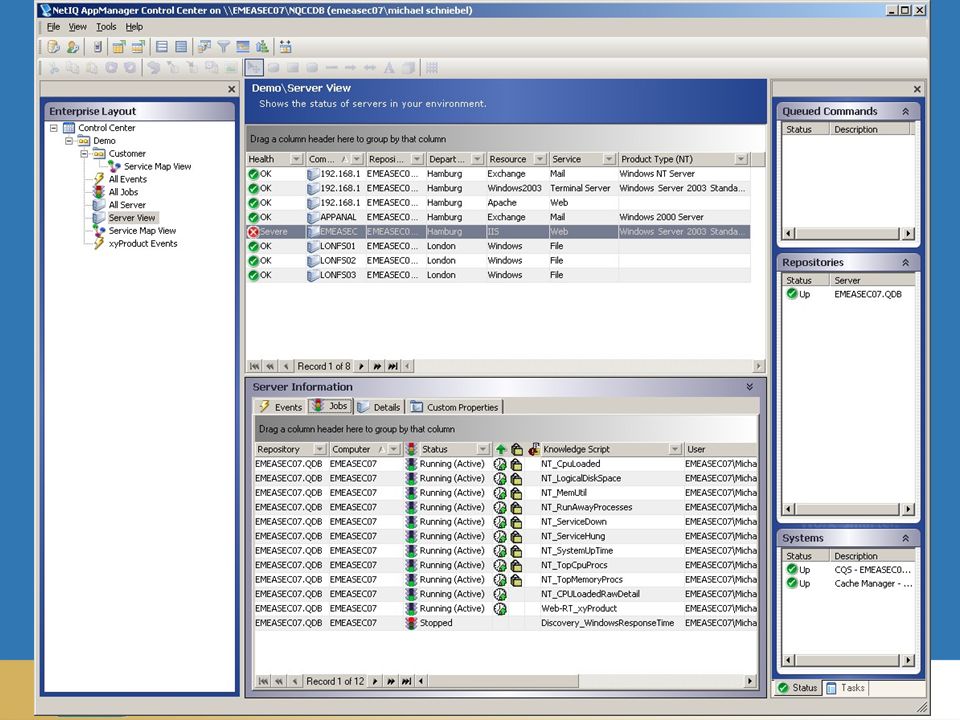
Control Center 1.0 (und Service View) Was ist das?
Die zentrale Enterprise Konsole in dem eine Verbindung zwischen Business Services und IT Infrastruktur hergestellt wird Skalierbare Lösung für den AppManager Managed 1000de von Servern/Objekten von einer Single Console aus Überwacht vielfache AppManager repositories (QDBs) Bedient die komplexesten Umgegungen Management Guppen in einfachster Weise (innerhalb der IT Struktur) Access Control (Security) für jede Management Gruppe Synchronisiert Skripte quer durch das Unternehmen unter geographischen Gesichtspunkten High Performance UI Optimiert für spezifische Aktivitäten: Event Management, Job Management Dynamisches Listguppierung & Filterung Weitgreifende export Fähigkeiten
 Bedient die komplexesten Umgegungen. Management Guppen in einfachster Weise (innerhalb der IT Struktur) Access Control (Security) für jede Management Gruppe. Synchronisiert Skripte quer durch das Unternehmen unter geographischen Gesichtspunkten. High Performance UI. Optimiert für spezifische Aktivitäten: Event Management, Job Management. Dynamisches Listguppierung & Filterung. Weitgreifende export Fähigkeiten.")
32
Basis Funktionen Grundlage für zukünftige UI Zeitgemäße Bedienung
Hohe Performance Modernes "Look & Feel" Verbindungsglied zwischen Produkten (CCF) Zeitgemäße Bedienung Outlook-style Gruppieren Filtern Multi-line Events Gute Exportmöglichkeiten Excel , HTML, XML, Text Ganze Listen oder nur Bereiche Examples: * AC & AMDC are built on same CCF as CC All of our future work around real-time charting will go into CC instead of existing Chart Console You’re going to want CC to be your primary console
 Zeitgemäße Bedienung. Outlook-style. Gruppieren. Filtern. Multi-line Events. Gute Exportmöglichkeiten. Excel , HTML, XML, Text. Ganze Listen oder nur Bereiche. Examples: * AC & AMDC are built on same CCF as CC. All of our future work around real-time charting will go into CC instead of existing Chart Console. You’re going to want CC to be your primary console.")
33
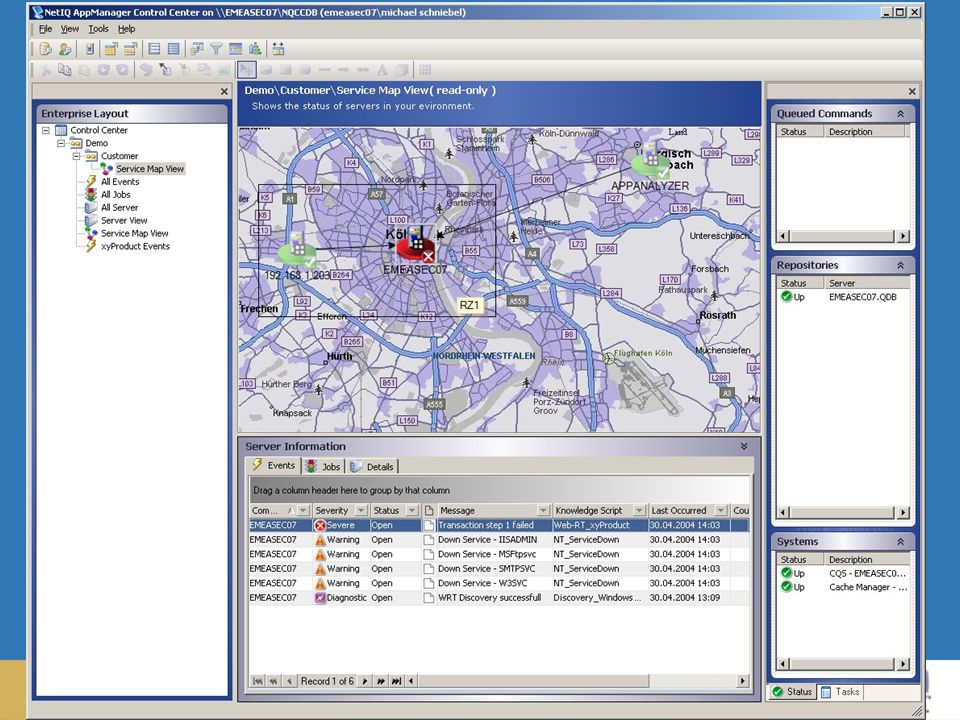
Service Map Views Visualisierung von IT Diensten Drilldown Anwendung
mehr als nur Topologie kann jedes Objekt im AM nutzen Drilldown Status Eingebettete Maps Event/Job/Details Anwendung Leitstände Service Management Dashboards

36
Service Sichten Helpdesk Callcenter Produktverantwortliche
Netzwerkoperations Leiter Betrieb

37
Übersicht der Umgebung
Helpdesk / Callcenter Übersicht der Umgebung Taskliste Offene Events

38
Produktverantwortliche
Serviceübersicht

39
Netzwerkoperations Verfügbarkeit

40
Leiter Betrieb Gesamtübersicht Drill Down Drill Down

41
AppManager 6 Diagnostics Console 2.0 Control Center 1.0
Service Map Viewer Analysis Center 2.0 Knowledge Base Dynamisches Threshold Management Eventkorrelation auf Datenebene

42
Analysis Center 2.0 Was ist das?
Reportingwerkzeug für SLM Metriken User Interface CCF-basierend, interaktive Konsole für ad-hoc Reporting und Reportgestaltung Granulare Securitykontrolle Performance & Scalability Die Komponenten können (und sollen) verteilt werden Aggregation auf Ebene der Data Marts redurziert die Last auf den QDB’s Report Queries laufen ausserhalb AM Verbesserte Reports und neue Reportarten Trend, Prediction, Threshold, Good-Acceptable-Poor, Uptime/Availability, Response Time, Dashboards Ca. 100 Reports vor-konfiguriert, out-of-the-box Offen für Customization & Integration Reports in XML definiert Verschiedene Exportmöglichkeiten (i.e. XLS, PDF, TIFF, CSV, HTML, etc.)
 verteilt werden. Aggregation auf Ebene der Data Marts redurziert die Last auf den QDB’s. Report Queries laufen ausserhalb AM. Verbesserte Reports und neue Reportarten. Trend, Prediction, Threshold, Good-Acceptable-Poor, Uptime/Availability, Response Time, Dashboards. Ca. 100 Reports vor-konfiguriert, out-of-the-box. Offen für Customization & Integration. Reports in XML definiert. Verschiedene Exportmöglichkeiten (i.e. XLS, PDF, TIFF, CSV, HTML, etc.)")
43
NetIQ Analysis Center 2.0 Console

44
Navigation tree for configuration, security, and report management

45
Interactive Chart & Table

46
Servers, Server Groupings, Metrics, Measures, Time Ranges, & Custom Report Properties

47
Trend & Prediction Example

48
Good – Acceptable – Poor Example

49
Dashboard Example

50
Analysis Center 2.0 Beispiel: Service Compliance (web)
")
51
AppManager 6 Diagnostics Console 2.0 Control Center 1.0
Service Map Viewer Analysis Center 2.0 Knowledge Base Dynamisches Threshold Management Eventkorrelation auf Datenebene

52
Kettenreaktionen durch manuelle Schwellwertfestlegung
falscher Alarm unnötiges einbeziehen des Helpdesk verschwendete Zeit der Experten Constant and irregular system fluctuations make it humanly impossible to discern “normal” performance. As a result, manual baselining and thresholding is inherently inaccurate -- not to mention time-consuming. This leads to false and missed alerts that create unhappy users, ineffective staff, avoidable service interruptions and escalating costs. verpasster Alarm Ausfälle oder Einbussen unproduktive oder unzufriedene User manuelle Schwellwert- festlegung im Labor

53
Der AMPP Prozess System-Verified Trusted Alarms
Actionable Trusted Tickets Automated Thresholding System-Verified Trusted Alarms Fast Problem Resolution Happy & Productive Users By automating your threshold administration process, Netuitive delivers actionable Trusted Alarms which enable you to diagnose and resolve problems up to 10x faster. It also eliminates all of the associated costs around labor-intensive manual baselining and thresholding, escalation of false trouble tickets, wasted IT staff time and avoidable service interruptions. Netuitive SI streamlines the entire performance management process and eliminates the chain reaction of inefficiencies which occur with manual thresholding.

54
Verpasste Alarme T T ! Static Threshold
Just as important, you want to be able to track and be alerted for system activity that drops to a level below that of your normal activity as shown here. The traditional static threshold is incapable of recognizing and alerting to this kind of significant system variance. T

55
AMPP – Alles auf einem Blick

56
User Interface (Tomcat)
Product Architektur Internet Explorer Netscape Navigator Mozilla firefox Web Browser AMPP 3.0 User Interface (Tomcat) C++ Every 15 min. Analytics Engine Data Collector Alarm (xml) Alarm Exporter OS Template Other Templates Alarm History Style Sheets AMPPDB Core File AI Rules AI Rules MSSQL 2000 AM Console drill-down Raw Data values Trusted Alarms (via netiqole.dll) AppManager QDB(s) Every 15 min (SQL/ODBC) Every 5 min. AMPP Custom KS’s
 C++ Every 15 min. Analytics. Engine. Data Collector. Alarm. (xml) Alarm Exporter. OS. Template. Other. Templates. Alarm History. Style Sheets. AMPPDB. Core File. AI Rules. AI Rules. MSSQL AM Console. drill-down. Raw Data values. Trusted Alarms (via netiqole.dll) AppManager QDB(s) Every 15 min (SQL/ODBC) Every 5 min. AMPP Custom KS’s.")
57
AppManager und seine Technik

58
Danke für Ihre Aufmerksamkeit?

Ähnliche Präsentationen


 Torsten Heinen German Remote Sensing Data Center (DLR/DFD)>")


