Präsentation herunterladen
Die Präsentation wird geladen. Bitte warten

1
Lutz Ribbe Warsaw, 2.3.2011 The EESC and the CAP reform 2014

2
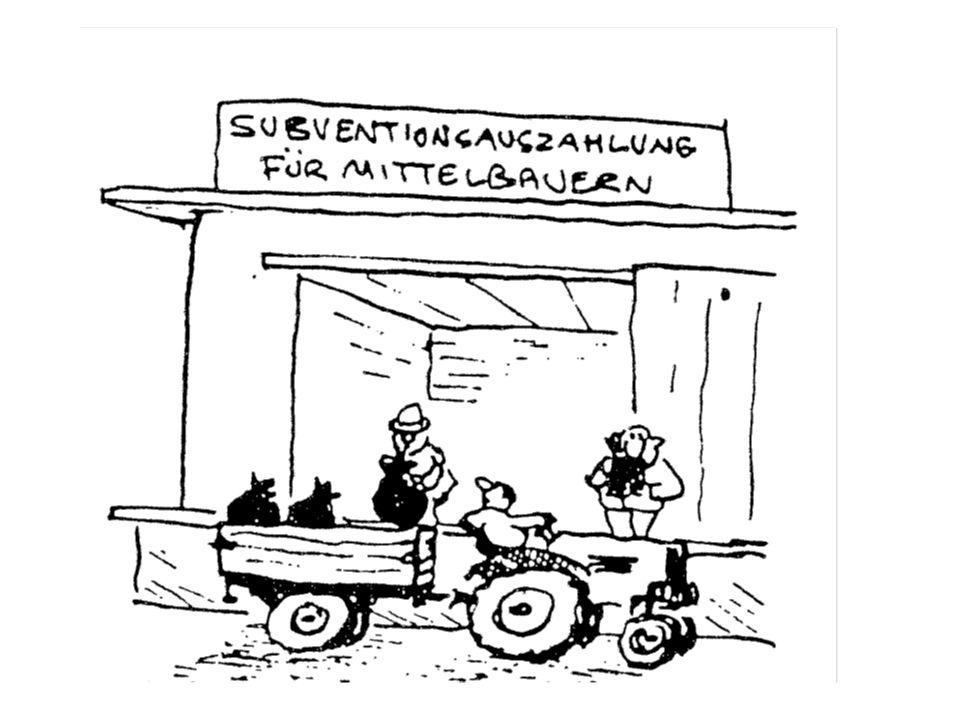
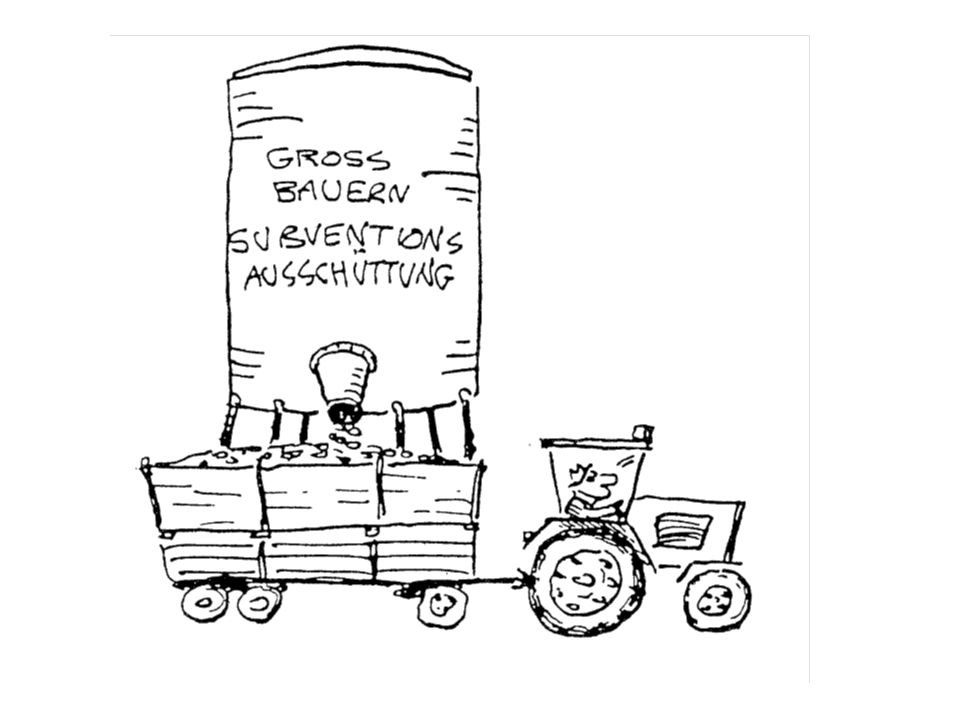
EU Agri commissar MacSharry 1992 we destroy farms/ jobs and the environment with the billion we spend 20% of farmer receive 80% of all payments a need for new objectives: –to motivate farmers to stay in the sector, to save the environment, to develop rural areas –All instruments should be linked to these goals result: 5% der Mittel in flankierende Maßnahmen heute: 20% der Bauern erhalten 85% der Zahlungen

3
Objectives and Instruments of the CAP For what or for whom the CAP is created for? Before speaking about instruments, we should speak about the objectives Instuments: not just spending money market stabilization!!!

4
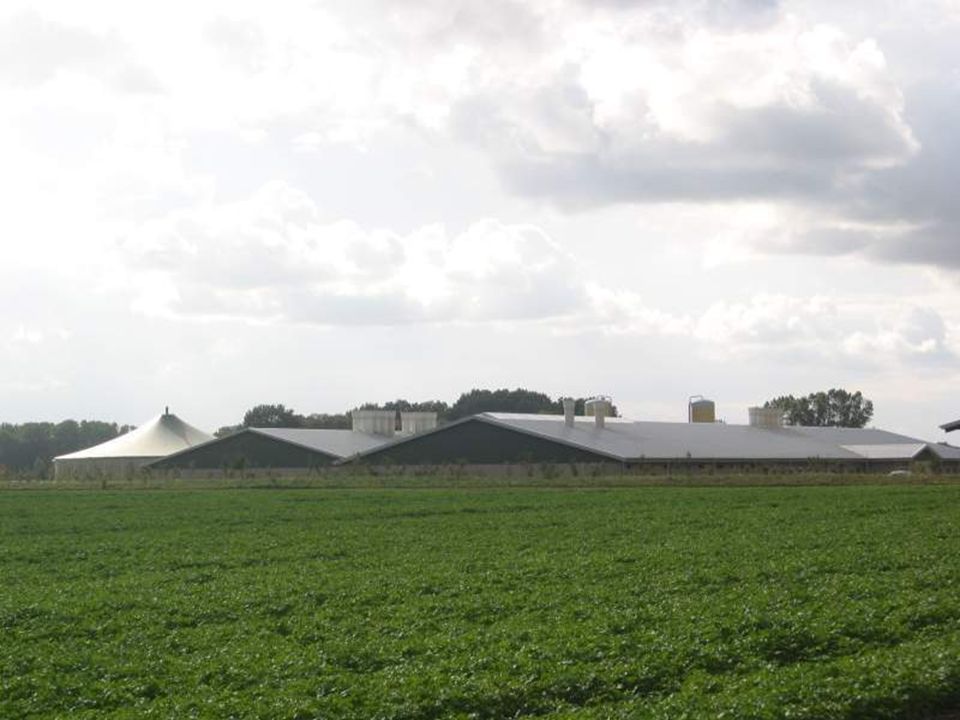
EESC: What do we want, and: what does CAP wants?Farming industrial o industrial orientation Agriculture multifunctional orientation Main goal: to compete on the world market to implement the Europ. agriculture modal

5
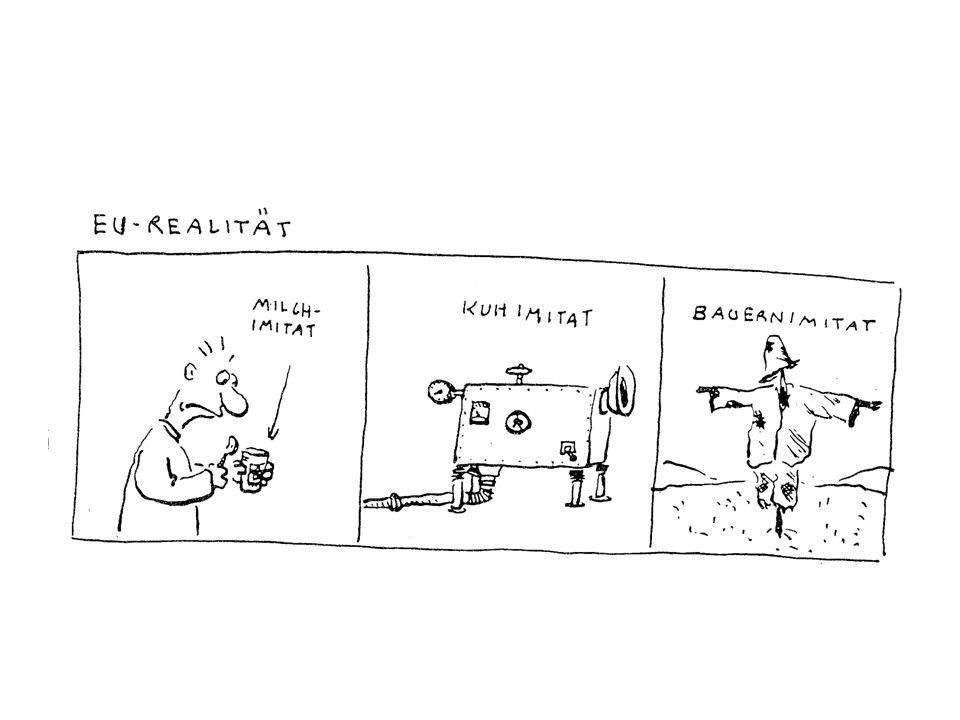
farming/ cost leadership => traditional CAP –role of farmer: to produce row material in the most cheapest way –become more and more productive –rationalize, intensification of production –squeeze out soil, plants, animals … –… and the farmer himself – grow or go ( structural change) Food industry is asking: do we need farmer?
 Food industry is asking: do we need farmer")
6
aus: Der Spiegel 43/2000

7
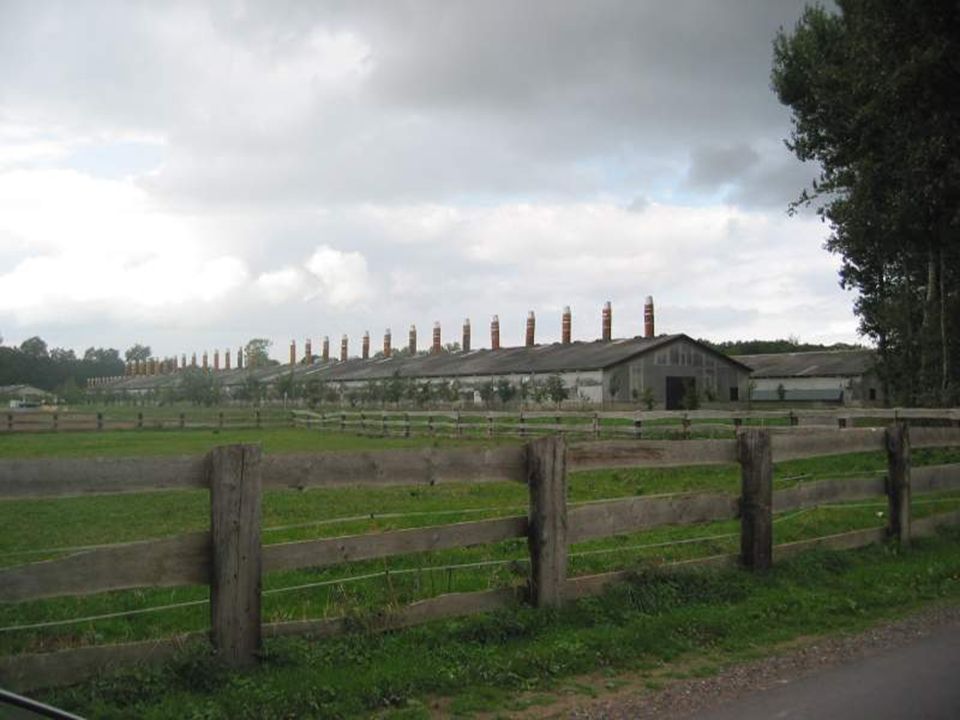
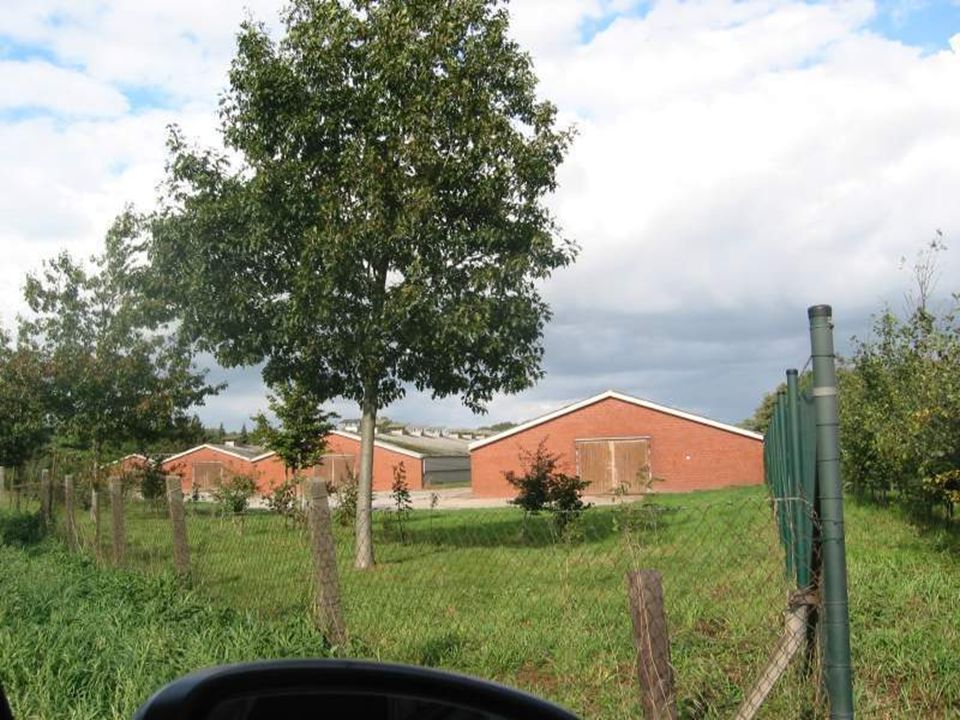
Grafik: Der Spiegel (2000) Geplanter Deltapark im Hafen von Rotterdam
 Geplanter Deltapark im Hafen von Rotterdam")
18
Bodenerosion auf Ackerstandorten

23
Keine Daten vorhanden < 10 10 – 40 40 – 80 80 – 120 120 – 170 > 170

24
Folgen französischer Viehwirtschaft Tödliche Algen Die Grünalgen sind zur Plage geworden und müssen aufwändig entsorgt werden. Foto: ap

26
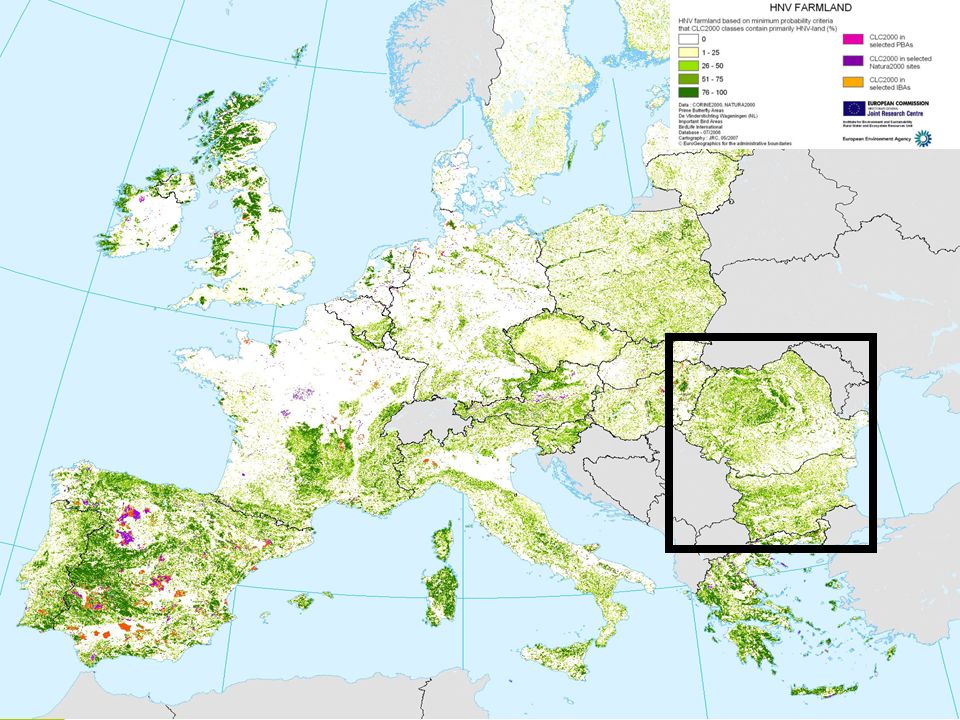
Biodiversität Die Gemeinsame Agrarpolitik (GAP) ist das politische Instrument, das sich am stärksten auf die biologische Vielfalt im ländlichen Raum auswirkt... KOM(2010) 548, S. 5
 548, S. 5.")
28
28

29
… until 2014 existing CAP will distroy about … 2 million fulltime jobs EU (15) 1 to 2 million fulltime jobs in EU (10) another 1 to bis 2 million fulltime jobs in Bulgaria and Romania Zu diesen Zahlen müssen noch rund 5 Millionen verdeckte Erwerbslose in den landwirtschaftlichen Betrieben hinzugezählt werden.
 1 to 2 million fulltime jobs in EU (10) another 1 to bis 2 million fulltime jobs in Bulgaria and Romania Zu diesen Zahlen müssen noch rund 5 Millionen verdeckte Erwerbslose in den landwirtschaftlichen Betrieben hinzugezählt werden.")
32
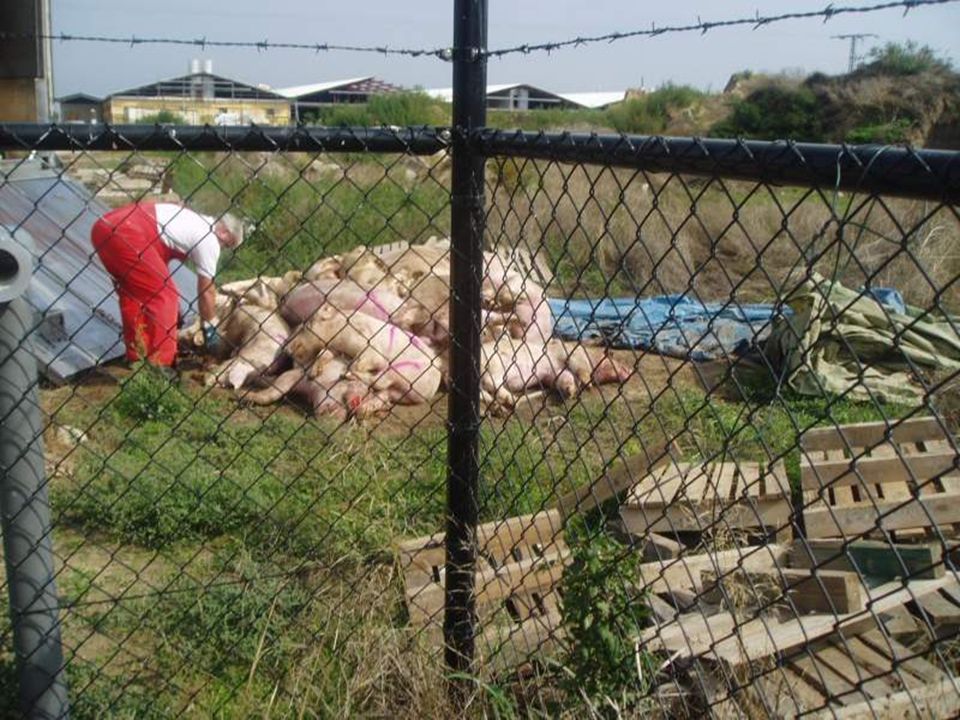
Just some of the negative consequences –loss of biodiversity –water pollution –climate questions –animal welfare (mass production 80.000 pigs?) –problems in rural areas –quality of our food (what is quality? EU defintion?) –…..
 –…...")
33
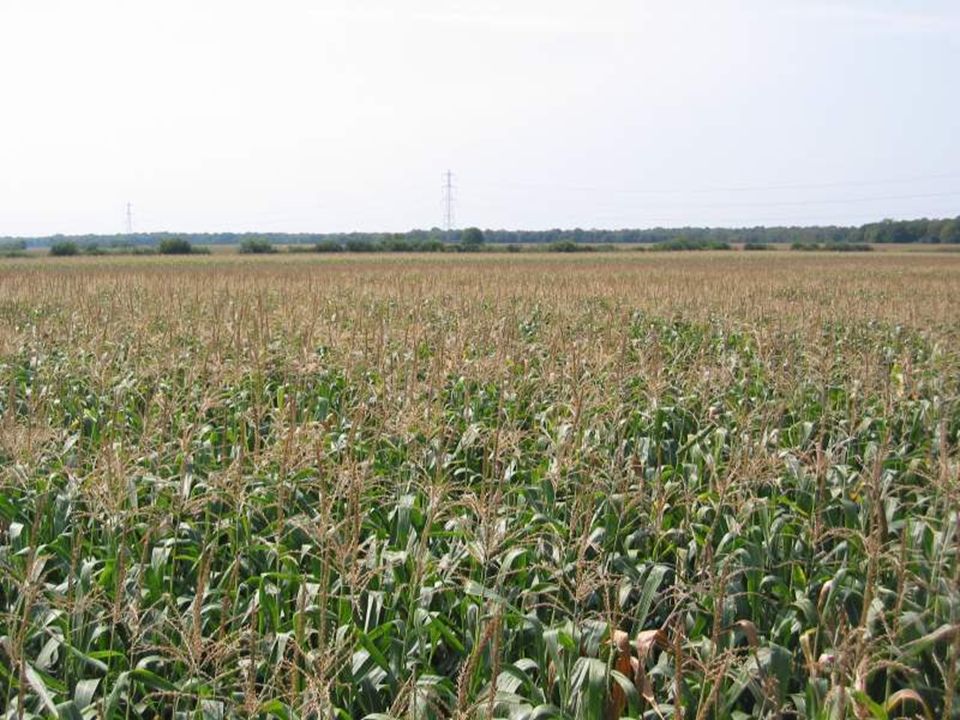
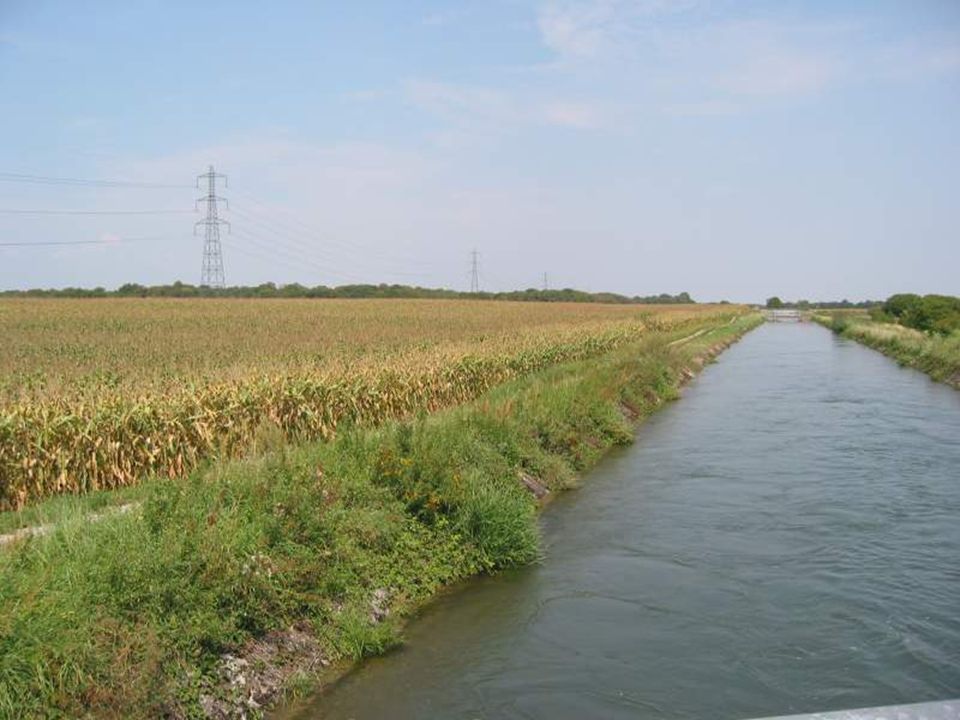
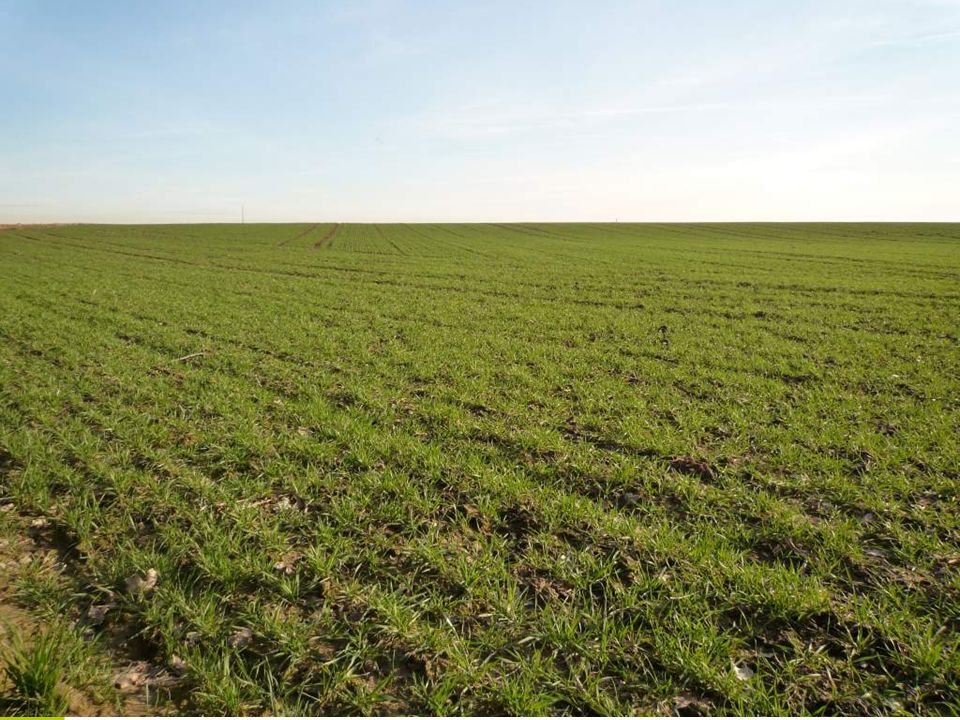
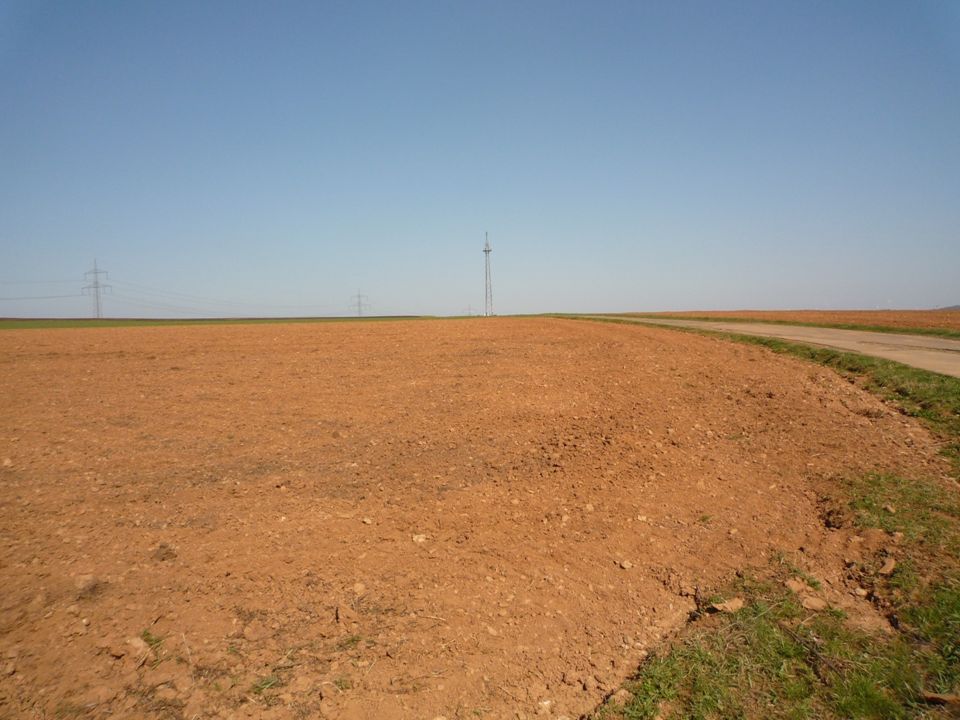
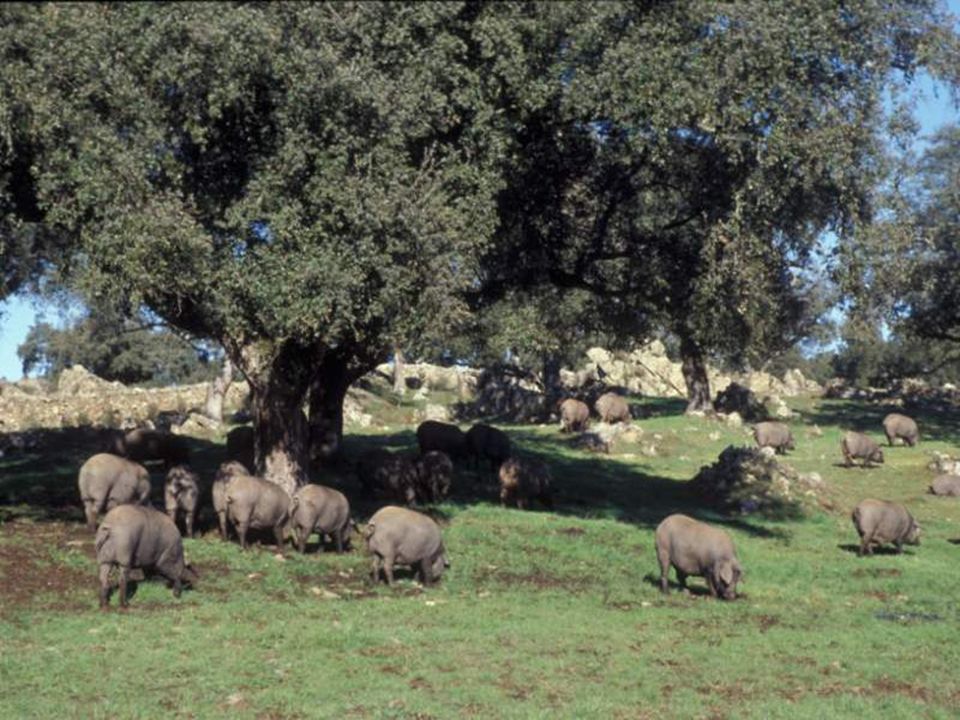
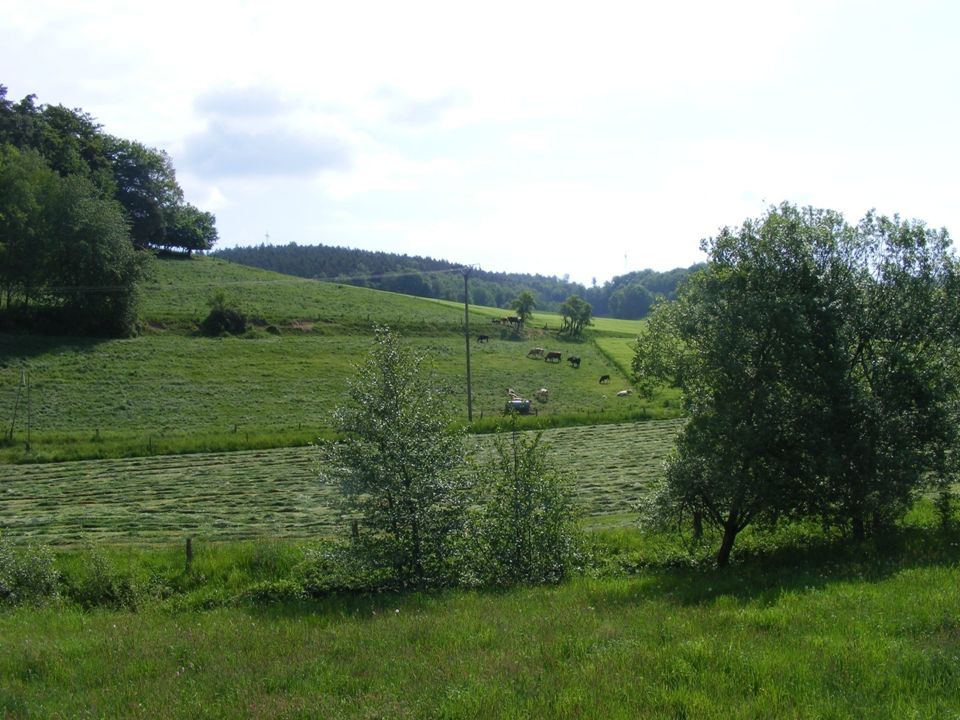
#2: multifuncional Agriculture Competitiveness by: –diversification (not just row material) –more ecological friendly production (public goods) –higher quality (not only organic farming) –Regional and local market (Ciolos) 2nd pillar the european agriculture modal
 –more ecological friendly production (public goods) –higher quality (not only organic farming) –Regional and local market (Ciolos) 2nd pillar the european agriculture modal")
34
Brandenburg

35
Hohenlohe, Baden-Württemberg

36
Podlassien, Polen

37
Narew, Polen

42
Vogesen, Frankreich

43
Berechnung Prof. Heissenhuber

44
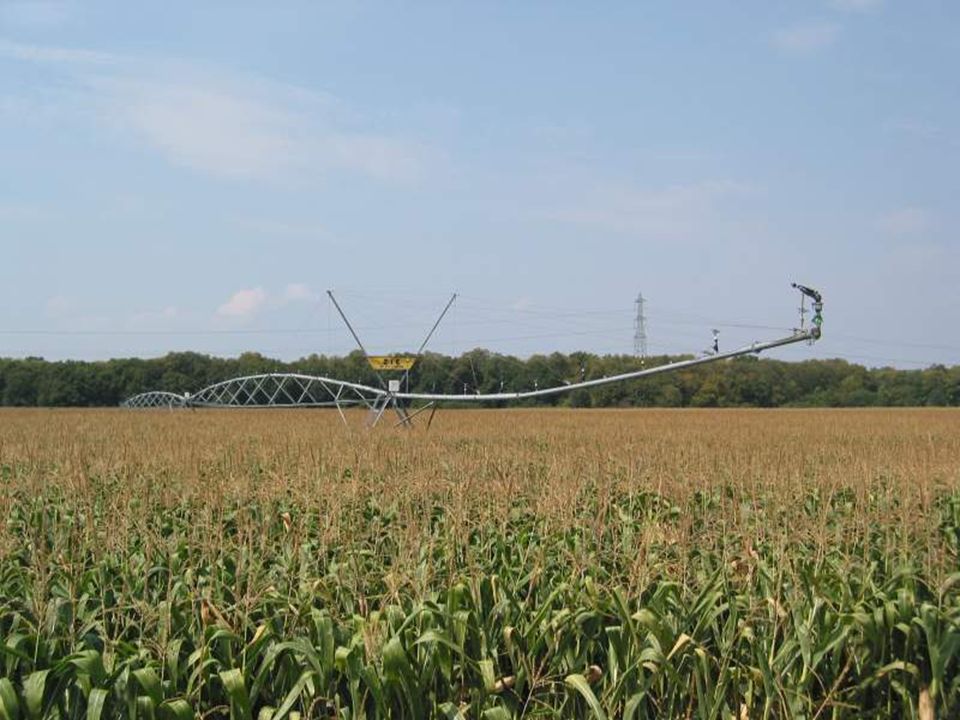
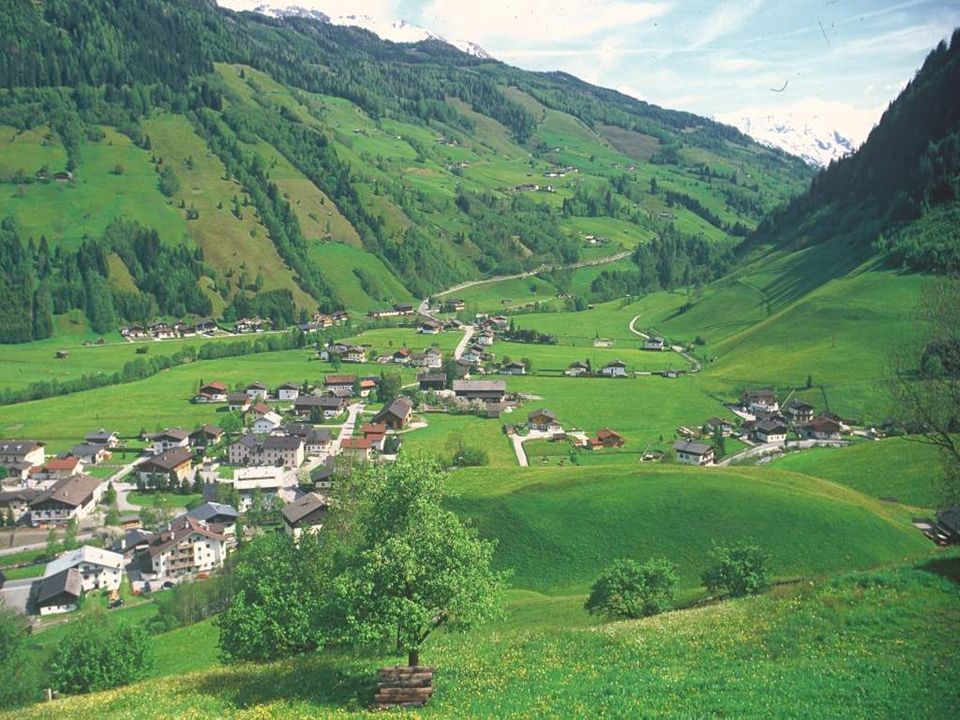
44 European Agriculture Modal EESC (and many ngo`s) is promoting a sustainable agriculture, which is taking into account… –environmental questions (biodiv, climate, water, soil, …) –consumer, animal welfare, regional …. interests –social criteria's (within EU and outside!) –millennium goals (hunger/ 3 rd world aspects) –countryside and landscape aspects agriculture EU on the path to the Europ. Agriculture Modal? EESC: NO!!!! Agroindustry No chance under world market conditions
 –millennium goals (hunger/ 3 rd world aspects) –countryside and landscape aspects agriculture EU on the path to the Europ. Agriculture Modal. EESC: NO!!!. Agroindustry No chance under world market conditions.")
45
CAP reform beyond 2013 Communication of the Commission published 18.11.10 Ciolos: CAP must become more fair and more green

46
EU agriculture budget 2006 (EU25) Total 54.771,9 Mio.
 Total ,9 Mio.")
47
two pillar of CAp 1. pillar Direct payments market regulations ca. 40 Mrd /a 2. pillar: Rural development ca. 12 Mrd /a

48
1. pillar CAP Direct payments and market regulations: –until 1992: price guarantees –1992 – 2003: price compensation –since 2003: decoupled payments –decoupled? –for what taxpayers money is spend?

49
is the existing system unfair? Ciolos: a more fair system?

50
direct payments per ha EU(27)
")
51
direct payments EU (27) 2009 farmspayments numbers in % in Mio in % less than 5.000 6.415,210 81,5% 5.791,4 14,8% 5.000 - 20.000 974.590 12,4% 9.937,2 25,4% 20.000 - 100.000 447.900 5,7% 17.191,7 43,9% <100.000 30.870 0,4% 6.196,6 15,8% Summe7.868,570 100,0% 39.116,9 100,0% Quelle: EU Finanzstatistik
 2009 farmspayments numbers in % in Mio in % less than ,210 81,5% 5.791,4 14,8% ,4% 9.937,2 25,4% ,7% ,7 43,9% < ,4% 6.196,6 15,8% Summe7.868, ,0% ,9 100,0% Quelle: EU Finanzstatistik")
52
direct payments in Poland 2006 Farms in PlPayments in Pl numberin %in Mio in % Less than 1.250 1.367.03093,3%465,63 57,7% 1.250 - 5.000 88.1406,0%178,43 22,1% 5.000 - 20.000 7.5100,5%67,19 8,3% 20.000 - 100.000 1.9600,1%72,52 9,0% More than 100.000 1400,0%23,26 2,9% Summe1.464.970100,0%807,02 100,0% Quelle: EU Finanzstatistik > 20 = 45.600, < 1.250 = 340

53
direct payments in Germany 2009 Farms in Dpayments in D Number in % in Mio in % Less than 5.000 179.552 49,7% 279,19 4,8% 5.000 - 20.000 107.580 29,8% 1.174,88 20,4% 20.000 - 100.000 67.930 18,8% 2.545,94 44,2% <100.000 6.324 1,7% 1.760,88 30,6% Summe361.386 100,0% 5.760,89 100,0% Quelle: BMELV Finanzstatistik

54
Direktzahlungen und Einkommen

58
2nd pillar of CAP Rural development Axis 1:Investments in farms Axis 2:promotion of environment friendly land-use system Nature conservation/ Natura 2000 etc. Achse 3:rural development + LEADER money for clearly defined projects

59
Anteil der 2. Säule an den EU-Agrarausgaben (Vollzug 2005) Agricultural expenditures (total) EAGGF Guarantee (05 04) EAGGF Guidance Total Rural Developmentin % Austria 1.256,30 479,10 20,60 499,70 39,8% Belgium 1.042,60 56,10 8,10 64,20 6,2% Cyprus 58,80 25,10 0,00 25,10 42,7% Czec 519,40 182,00 55,60 237,60 45,7% Denmark 1.228,00 46,20 3,10 49,30 4,0% Estonia 96,00 50,40 18,60 69,00 71,9% EU (25) 52.628,70 6.845,80 3.959,50 10.805,30 20,5% Finland 947,50 336,90 44,60 381,50 40,3% France 10.106,00 879,50 137,10 1.016,60 10,1% Germany 7.014,40 803,80 511,30 1.315,10 18,7% Greece 3.275,90 157,30 521,90 679,20 20,7% Hungary 821,20 201,90 104,40 306,30 37,3% Ireland 1.827,10 357,50 20,90 378,40 20,7% Italy 6.080,10 679,80 580,40 1.260,20 20,7% Latvia 170,50 110,00 33,00 143,00 83,9% Lithuania 333,00 164,10 41,80 205,90 61,8% Luxemburg 45,40 16,00 0,40 16,40 36,1% Malta 11,30 9,00 1,40 10,40 92,0% Netherlands 1.273,80 63,50 17,50 81,00 6,4% Poland 2.237,20 961,00 398,20 1.359,20 60,8% Portugal 1.232,40 178,90 341,40 520,30 42,2% Slovakia 308,00 133,10 60,50 193,60 62,9% Slovenia 135,20 94,40 7,90 102,30 75,7% Spain 7.341,70 533,90 935,20 1.469,10 20,0% Sweden 981,20 170,70 24,90 195,60 19,9% UK 4.285,70 155,60 70,70 226,30 5,3%
 Agricultural expenditures (total) EAGGF Guarantee (05 04) EAGGF Guidance Total Rural Developmentin % Austria 1.256,30 479,10 20,60 499,70 39,8% Belgium 1.042,60 56,10 8,10 64,20 6,2% Cyprus 58,80 25,10 0,00 25,10 42,7% Czec 519,40 182,00 55,60 237,60 45,7% Denmark 1.228,00 46,20 3,10 49,30 4,0% Estonia 96,00 50,40 18,60 69,00 71,9% EU (25) , , , ,30 20,5% Finland 947,50 336,90 44,60 381,50 40,3% France ,00 879,50 137, ,60 10,1% Germany 7.014,40 803,80 511, ,10 18,7% Greece 3.275,90 157,30 521,90 679,20 20,7% Hungary 821,20 201,90 104,40 306,30 37,3% Ireland 1.827,10 357,50 20,90 378,40 20,7% Italy 6.080,10 679,80 580, ,20 20,7% Latvia 170,50 110,00 33,00 143,00 83,9% Lithuania 333,00 164,10 41,80 205,90 61,8% Luxemburg 45,40 16,00 0,40 16,40 36,1% Malta 11,30 9,00 1,40 10,40 92,0% Netherlands 1.273,80 63,50 17,50 81,00 6,4% Poland 2.237,20 961,00 398, ,20 60,8% Portugal 1.232,40 178,90 341,40 520,30 42,2% Slovakia 308,00 133,10 60,50 193,60 62,9% Slovenia 135,20 94,40 7,90 102,30 75,7% Spain 7.341,70 533,90 935, ,10 20,0% Sweden 981,20 170,70 24,90 195,60 19,9% UK 4.285,70 155,60 70,70 226,30 5,3%.")
60
Share of Rural Development on all agriculture expenditures in the EU25 (implementation 2005) Agricultural expenditures (total) EAGGF Guarantee (05 04) EAGGF Guidance Total Rural Developmentin % Austria 1.256,30 479,10 20,60 499,70 39,8% Belgium 1.042,60 56,10 8,10 64,20 6,2% Cyprus 58,80 25,10 0,00 25,10 42,7% Czec 519,40 182,00 55,60 237,60 45,7% Denmark 1.228,00 46,20 3,10 49,30 4,0% Estonia 96,00 50,40 18,60 69,00 71,9% EU (25) 52.628,70 6.845,80 3.959,50 10.805,30 20,5% Finland 947,50 336,90 44,60 381,50 40,3% France 10.106,00 879,50 137,10 1.016,60 10,1% Germany 7.014,40 803,80 511,30 1.315,10 18,7% Greece 3.275,90 157,30 521,90 679,20 20,7% Hungary 821,20 201,90 104,40 306,30 37,3% Ireland 1.827,10 357,50 20,90 378,40 20,7% Italy 6.080,10 679,80 580,40 1.260,20 20,7% Latvia 170,50 110,00 33,00 143,00 83,9% Lithuania 333,00 164,10 41,80 205,90 61,8% Luxemburg 45,40 16,00 0,40 16,40 36,1% Malta 11,30 9,00 1,40 10,40 92,0% Netherlands 1.273,80 63,50 17,50 81,00 6,4% Poland 2.237,20 961,00 398,20 1.359,20 60,8% Portugal 1.232,40 178,90 341,40 520,30 42,2% Slovakia 308,00 133,10 60,50 193,60 62,9% Slovenia 135,20 94,40 7,90 102,30 75,7% Spain 7.341,70 533,90 935,20 1.469,10 20,0% Sweden 981,20 170,70 24,90 195,60 19,9% UK 4.285,70 155,60 70,70 226,30 5,3%
 Agricultural expenditures (total) EAGGF Guarantee (05 04) EAGGF Guidance Total Rural Developmentin % Austria 1.256,30 479,10 20,60 499,70 39,8% Belgium 1.042,60 56,10 8,10 64,20 6,2% Cyprus 58,80 25,10 0,00 25,10 42,7% Czec 519,40 182,00 55,60 237,60 45,7% Denmark 1.228,00 46,20 3,10 49,30 4,0% Estonia 96,00 50,40 18,60 69,00 71,9% EU (25) , , , ,30 20,5% Finland 947,50 336,90 44,60 381,50 40,3% France ,00 879,50 137, ,60 10,1% Germany 7.014,40 803,80 511, ,10 18,7% Greece 3.275,90 157,30 521,90 679,20 20,7% Hungary 821,20 201,90 104,40 306,30 37,3% Ireland 1.827,10 357,50 20,90 378,40 20,7% Italy 6.080,10 679,80 580, ,20 20,7% Latvia 170,50 110,00 33,00 143,00 83,9% Lithuania 333,00 164,10 41,80 205,90 61,8% Luxemburg 45,40 16,00 0,40 16,40 36,1% Malta 11,30 9,00 1,40 10,40 92,0% Netherlands 1.273,80 63,50 17,50 81,00 6,4% Poland 2.237,20 961,00 398, ,20 60,8% Portugal 1.232,40 178,90 341,40 520,30 42,2% Slovakia 308,00 133,10 60,50 193,60 62,9% Slovenia 135,20 94,40 7,90 102,30 75,7% Spain 7.341,70 533,90 935, ,10 20,0% Sweden 981,20 170,70 24,90 195,60 19,9% UK 4.285,70 155,60 70,70 226,30 5,3%")
61
Share of Rural Development on all agriculture expenditures in the EU25 (implementation 2005) Agricultural expenditures (total) EAGGF Guarantee (05 04) EAGGF Guidance Total Rural Developmentin % Austria 1.256,30 479,10 20,60 499,70 39,8% Belgium 1.042,60 56,10 8,10 64,20 6,2% Cyprus 58,80 25,10 0,00 25,10 42,7% Czec 519,40 182,00 55,60 237,60 45,7% Denmark 1.228,00 46,20 3,10 49,30 4,0% Estonia 96,00 50,40 18,60 69,00 71,9% EU (25) 52.628,70 6.845,80 3.959,50 10.805,30 20,5% Finland 947,50 336,90 44,60 381,50 40,3% France 10.106,00 879,50 137,10 1.016,60 10,1% Germany 7.014,40 803,80 511,30 1.315,10 18,7% Greece 3.275,90 157,30 521,90 679,20 20,7% Hungary 821,20 201,90 104,40 306,30 37,3% Ireland 1.827,10 357,50 20,90 378,40 20,7% Italy 6.080,10 679,80 580,40 1.260,20 20,7% Latvia 170,50 110,00 33,00 143,00 83,9% Lithuania 333,00 164,10 41,80 205,90 61,8% Luxemburg 45,40 16,00 0,40 16,40 36,1% Malta 11,30 9,00 1,40 10,40 92,0% Netherlands 1.273,80 63,50 17,50 81,00 6,4% Poland 2.237,20 961,00 398,20 1.359,20 60,8% Portugal 1.232,40 178,90 341,40 520,30 42,2% Slovakia 308,00 133,10 60,50 193,60 62,9% Slovenia 135,20 94,40 7,90 102,30 75,7% Spain 7.341,70 533,90 935,20 1.469,10 20,0% Sweden 981,20 170,70 24,90 195,60 19,9% UK 4.285,70 155,60 70,70 226,30 5,3%
 Agricultural expenditures (total) EAGGF Guarantee (05 04) EAGGF Guidance Total Rural Developmentin % Austria 1.256,30 479,10 20,60 499,70 39,8% Belgium 1.042,60 56,10 8,10 64,20 6,2% Cyprus 58,80 25,10 0,00 25,10 42,7% Czec 519,40 182,00 55,60 237,60 45,7% Denmark 1.228,00 46,20 3,10 49,30 4,0% Estonia 96,00 50,40 18,60 69,00 71,9% EU (25) , , , ,30 20,5% Finland 947,50 336,90 44,60 381,50 40,3% France ,00 879,50 137, ,60 10,1% Germany 7.014,40 803,80 511, ,10 18,7% Greece 3.275,90 157,30 521,90 679,20 20,7% Hungary 821,20 201,90 104,40 306,30 37,3% Ireland 1.827,10 357,50 20,90 378,40 20,7% Italy 6.080,10 679,80 580, ,20 20,7% Latvia 170,50 110,00 33,00 143,00 83,9% Lithuania 333,00 164,10 41,80 205,90 61,8% Luxemburg 45,40 16,00 0,40 16,40 36,1% Malta 11,30 9,00 1,40 10,40 92,0% Netherlands 1.273,80 63,50 17,50 81,00 6,4% Poland 2.237,20 961,00 398, ,20 60,8% Portugal 1.232,40 178,90 341,40 520,30 42,2% Slovakia 308,00 133,10 60,50 193,60 62,9% Slovenia 135,20 94,40 7,90 102,30 75,7% Spain 7.341,70 533,90 935, ,10 20,0% Sweden 981,20 170,70 24,90 195,60 19,9% UK 4.285,70 155,60 70,70 226,30 5,3%")
62
2. Säule in der EU (27) EU Durchschnitt: knapp 20% aller EU-Agrarmittel in GB, DK, Belgien, Niederlande: unter 5% der EU-Agrarmittel in Deutschland 21% in Österreich, Portugal, Finnland: über 40% in Estland, Lettland, Slowenien, Malta: über 70 % jeweils zzgl. nationale Kofinanzierung
 EU Durchschnitt: knapp 20% aller EU-Agrarmittel in GB, DK, Belgien, Niederlande: unter 5% der EU-Agrarmittel in Deutschland 21% in Österreich, Portugal, Finnland: über 40% in Estland, Lettland, Slowenien, Malta: über 70 % jeweils zzgl. nationale Kofinanzierung.")
63
jobs in rural areas Müller-Milch in Leppersdorf (Sachsen) 70 Mio Zuschuss für die Vernichtung von rund 50 Arbeitsplätzen
 70 Mio Zuschuss für die Vernichtung von rund 50 Arbeitsplätzen")
64
64

65
EESC opinion on CAP reform 1.agreement on objectives/ goals of CAP 2.instruments, when agreement exist 3.CAP is much more than spending money: –Milk and concentration of animal production: the `free market` does not solve all problems Stabilisation of markets; where are the instruments? 4.world market, regional market rural development/ 2nd pillar, bottom up 5.a clear yes to direct payments, but: good legitimation (public money for public goods), link to jobs and environment
, link to jobs and environment.")
66
EESC opinion on CAP reform 6.greening 1 st pillar 7.concentration on active farmers 8.capping of payments 9.no historical payments anymore

67
… neue Wege gehen!

Ähnliche Präsentationen