Präsentation herunterladen
Die Präsentation wird geladen. Bitte warten

1
A historic turnaround in Germany and its consequences
Copenhagen

2
Growth in Germany was weak

3
Investment was and is the Achilles heel

4
Germany: export champion...

5
But stagnating domestic demand

6
Current account surplus very high

7
All German savings are exported!
Who is Who? (Government, private households,non-financial and financial companies, ROW)
")
8
Why do countries perform so differently?

9
Germany is the exception in terms of wages

10
Private consumtion like in Italy

11
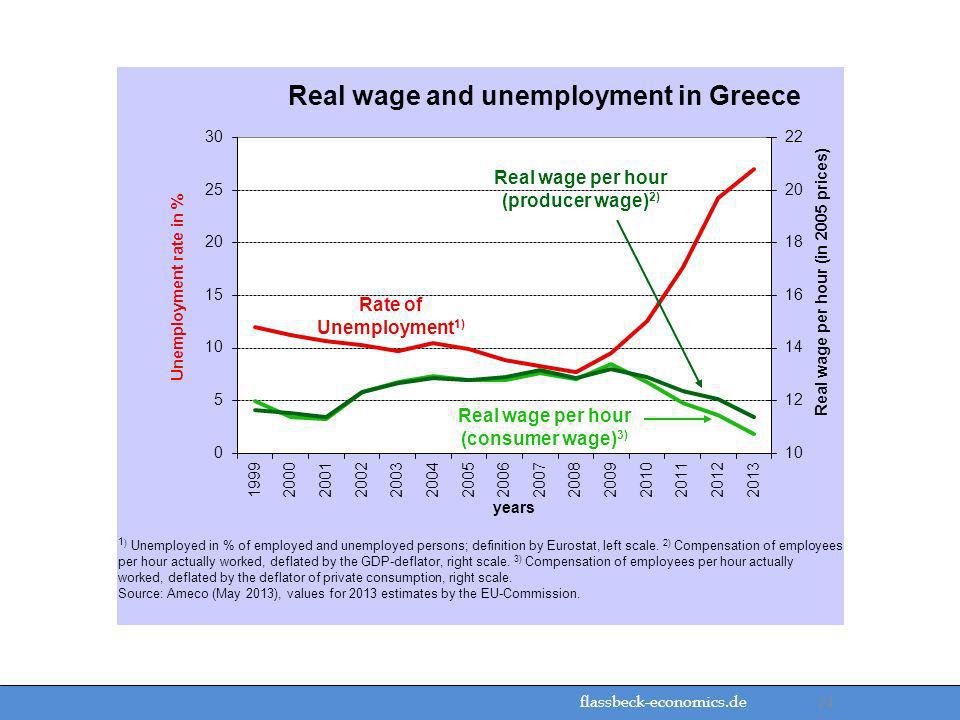
Official unemployment looks good but ...

12
... Real employment lagging behind (total number of hours worked)
")
13
Investment is sluggish

14
Including Denmark

15
Productivity is similar

16
But real wages (per hour) deviate
 deviate")
17
and unit labour costs (since 1999) are diverging
 are diverging")
18
No recovery nowhere (GDP growth)
")
19
Private consumption is the problem

20
And investment is a disaster

21
Investment ratios (% of GDP) very low
 very low")
22
REER: Is Germany the role model?

23
Official unemployment

26
Reallöhne in Frankreich und Deutschland: Wer liegt richtig?
Real wages per hour1) and productivity2) (1999 = 100) Notes: 1) Total real compensation of dependent employees divided by working hours of dependent employees times number of dependent employees. 2) Real GDP divided by working hours of total employed persons times number of employed persons. 3) Total nominal compensation of dependent employees is price adjusted by a constant inflation rate of 1.9%, apart from that same calculation as for 1) Source: AMECO database (as per Nov-12); OECD database (as per Apr-13); own calculations
 and productivity2) (1999 = 100) Notes: 1) Total real compensation of dependent employees divided by working hours of dependent employees times number of dependent employees. 2) Real GDP divided by working hours of total employed persons times number of employed persons. 3) Total nominal compensation of dependent employees is price adjusted by a constant inflation rate of 1.9%, apart from that same calculation as for 1) Source: AMECO database (as per Nov-12); OECD database (as per Apr-13); own calculations")
27
Nominallöhne in Deutschland...
Nominaler Stundenlohn1) und Produktivität2) – Deutschland (1999=100) Anmerkungen: 1) Definiert als nominale Einkommen der abhängig Beschäftigten geteilt durch die Arbeitsstunden der abhängig Beschäftigten mal Anzahl der abhängig Beschäftigten. 2) Definiert als reales BIP geteilt durch Arbeitsstunden aller Beschäftigten mal Anzahl aller Beschäftigten. 3) 2012er Werte für Arbeitsstunden der Beschäftigten geschätzt anhand von Destatis Daten. Quelle: AMECO Datenbank (Stand Nov-12); OECD Datenbank (Stand Apr-13); eigene Berechnungen
 und Produktivität2) – Deutschland (1999=100) Anmerkungen: 1) Definiert als nominale Einkommen der abhängig Beschäftigten geteilt durch die Arbeitsstunden der abhängig Beschäftigten mal Anzahl der abhängig Beschäftigten. 2) Definiert als reales BIP geteilt durch Arbeitsstunden aller Beschäftigten mal Anzahl aller Beschäftigten. 3) 2012er Werte für Arbeitsstunden der Beschäftigten geschätzt anhand von Destatis Daten. Quelle: AMECO Datenbank (Stand Nov-12); OECD Datenbank (Stand Apr-13); eigene Berechnungen")
28
Nominaler Stundenlohn und Produktivität – Frankreich (1999=100)
… und Frankreich Nominaler Stundenlohn und Produktivität – Frankreich (1999=100) Anmerkungen: 1) 2012er Werte für Arbeitsstunden der Beschäftigten geschätzt anhand von AMECO Daten. Quelle: AMECO Datenbank (Stand Nov-12); OECD Datenbank (Stand Apr-13); eigene Berechnungen
 Anmerkungen: 1) 2012er Werte für Arbeitsstunden der Beschäftigten geschätzt anhand von AMECO Daten. Quelle: AMECO Datenbank (Stand Nov-12); OECD Datenbank (Stand Apr-13); eigene Berechnungen")
29
Nominale Löhne und (nominale) Produktivität/Stunde
Nominal wages1) and nominal productivity2) Notes: 1) Defined as total nominal compensation of dependent employees divided by working hours of dependent employees times number of dependent employees. 2) Defined as nominal GDP divided by working hours of total employed persons times number of employed persons. 3) 2012 values for working hours of total employees and dependent employees projected based on data from Destatis and AMECO Source: AMECO database (as per Nov-12); Eurostat; own calculations
 and nominal productivity2) Notes: 1) Defined as total nominal compensation of dependent employees divided by working hours of dependent employees times number of dependent employees. 2) Defined as nominal GDP divided by working hours of total employed persons times number of employed persons. 3) 2012 values for working hours of total employees and dependent employees projected based on data from Destatis and AMECO Source: AMECO database (as per Nov-12); Eurostat; own calculations")
30
Der entscheidende Zusammenhang
Wachstum der Lohnstückkosten1) (ULC) und Inflationsrate in EMU2) Anmerkungen: 1) Bruttoeinkommen in ECU bzw. Euro aus unselbständiger Arbeit je Beschäftigten dividiert durch reales BIP je Erwerbstätigen. 2) 12 Länder: Belgien, Deutschland, Finland, Frankreich, Griechenland, Irland, Italien, Luxemburg, Niederlande, Österreich, Portugal, Spanien Quelle: AMECO Datenbank (Stand Nov-12); eigene Berechnungen
 (ULC) und Inflationsrate in EMU2) Anmerkungen: 1) Bruttoeinkommen in ECU bzw. Euro aus unselbständiger Arbeit je Beschäftigten dividiert durch reales BIP je Erwerbstätigen. 2) 12 Länder: Belgien, Deutschland, Finland, Frankreich, Griechenland, Irland, Italien, Luxemburg, Niederlande, Österreich, Portugal, Spanien Quelle: AMECO Datenbank (Stand Nov-12); eigene Berechnungen")
31
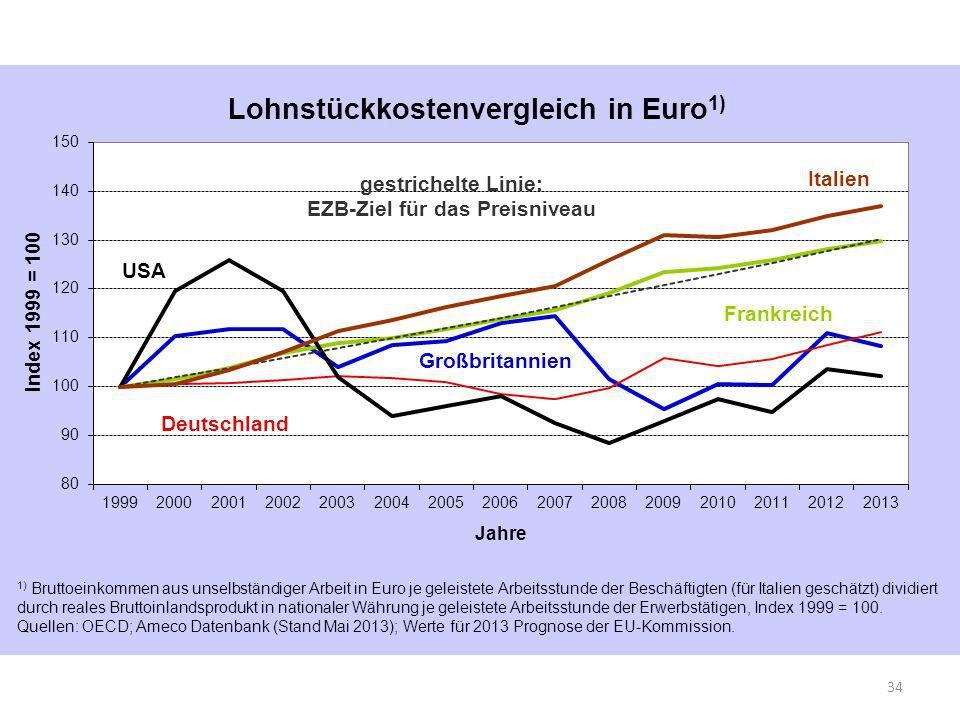
Deutschland unterbietet die anderen
Divergenz der Lohnstückkosten (1999 = 100) Quelle: AMECO Datenbank (Stand Nov-12); eigene Berechnungen
 Quelle: AMECO Datenbank (Stand Nov-12); eigene Berechnungen.")
32
Südeuropa bemüht sich – ohne jede Chance
Lohnstückkosten ausgewählter EMU Länder (1999 = 100) Quelle: AMECO Datenbank (Stand Nov-12); eigene Berechnungen
 Quelle: AMECO Datenbank (Stand Nov-12); eigene Berechnungen.")
33
Nur Ursachentherapie bringt eine Lösung
Szenario zur Konvergenz der Lohnstückkosten bis 2022 (1999 = 100) Quelle: AMECO Datenbank (Stand Nov-12); eigene Berechnungen
 Quelle: AMECO Datenbank (Stand Nov-12); eigene Berechnungen.")
35
Eine normale und eine seltsame Marktwirtschaft
Finanzierungssalden1) der Wirtschaftssektoren in Deutschland2) Anmerkungen: 1) Nettoschuldenposition eines Wirtschaftssektors im Verhältnis zum Bruttonationaleinkommen (BNE). Gleitende Dreijahresdurchschnitte. 2) Bis 1991 Westdeutschland, ab 1991 Deutschland. Quellen: Bundesministerium der Finanzen, Abgrenzung teilweise abweichend von ESA95, Stand 1991; AMECO Datenbank, Stand Mai-11.
 der Wirtschaftssektoren in Deutschland2) Anmerkungen: 1) Nettoschuldenposition eines Wirtschaftssektors im Verhältnis zum Bruttonationaleinkommen (BNE). Gleitende Dreijahresdurchschnitte. 2) Bis 1991 Westdeutschland, ab 1991 Deutschland. Quellen: Bundesministerium der Finanzen, Abgrenzung teilweise abweichend von ESA95, Stand 1991; AMECO Datenbank, Stand Mai-11.")
Ähnliche Präsentationen