Präsentation herunterladen
Die Präsentation wird geladen. Bitte warten

1
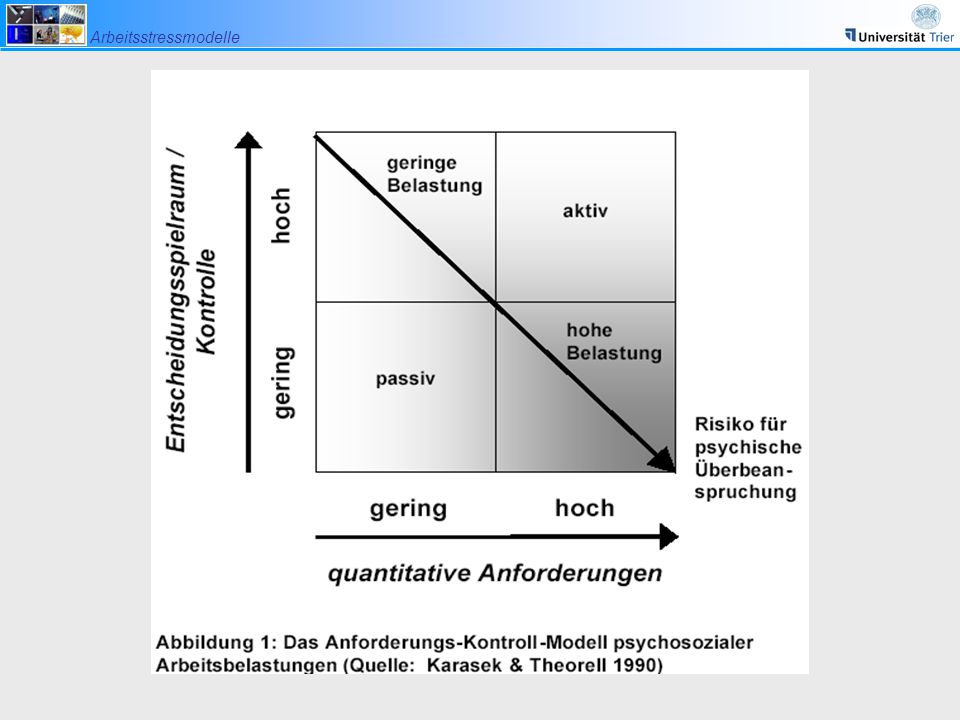
Arbeitsstressmodelle „Stress at Work meets Biopsychology“

2
Studien zu Stressbelastung und Burnout - Integration arbeitspsychologischer und psychobiologischer Forschungsmethoden zur Erfassung differentieller Stressmuster bei chronischem Arbeitsstress

3
Die Tagespresse dass bis zu einem Drittel der
Lehrkräfte unter dem Burn-Out-Syndrom“ leiden. 2001

4
remaining administration
Disability for Service 2000 Retirement Total Due to Disability % - Disability Male Female Total Teacher (< A13) 292 391 683 230 324 554 78,8 82,9 81,1 Teacher (> A13) 261 75 336 153 49 202 58,6 65,3 60,1 Teacher total 553 466 1019 383 373 756 69,3 80,0 74,2 Academia 33 4 37 6 2 8 18,2 50,0 21,6 Police / Jjudiciary 258 264 104 110 40,3 100,0 41,7 remaining administration Lower grade 122 9 131 81 89 66,4 88,9 67,9 Middle grade 164 17 181 85 13 98 51,8 76,5 54,1 Higher grade 137 146 43 47 31,4 44,4 32,2 Administration total 423 35 458 209 25 234 49,4 71,4 51,1 Sum 1267 511 1778 702 406 1108 55,4 79,5 62,3 primarily depressive symptoms & exhaustion/burnout (Weber et al., 2002) Source: ZBV und Beamtenversorgungsbericht Rheinland-Pfalz
 ,8. 82,9. 81,1. Teacher (> A13) ,6. 65,3. 60,1. Teacher total ,3. 80,0. 74,2. Academia ,2. 50,0. 21,6. Police / Jjudiciary ,3. 100,0. 41,7. remaining administration. Lower grade ,4. 88,9. 67,9. Middle grade ,8. 76,5. 54,1. Higher grade ,4. 44,4. 32,2. Administration total ,4. 71,4. 51,1. Sum ,4. 79,5. 62,3. primarily depressive symptoms & exhaustion/burnout (Weber et al., 2002) Source: ZBV und Beamtenversorgungsbericht Rheinland-Pfalz.")
5
Burnout / Vitale Erschöpfung Erfassung von „Job Strain“:
Erfassung von psychischer Belastung/Beanspruchung am Arbeitsplatz Burnout / Vitale Erschöpfung Erfassung von „Job Strain“: Beanspruchung und Handlungsspielraum: “Job Demand-Control“ Erfassung von Gratifikationskrisen: “Effort-Reward Imbalance“ Überengagement: “Overcommitment“

6
Norm DIN EN ISO Quelle: Website zur Norm DIN EN ISO 10075

7
Appels: Vitale Erschöpfung aus: Kopp et al
Appels: Vitale Erschöpfung aus: Kopp et al. (1998) Psychosom Med, 60:752-8 Fühlen Sie sich oft müde? Haben Sie oft Probleme einzuschlafen? Wachen Sie Nachts öfters auf? Fühlen Sie sich ausgelaugt? Fühlen Sie sich in letzter Zeit lustloser als früher? Irritieren Sie Kleinigkeiten in letzter Zeit mehr als früher? Haben Sie das Gefühl: " Meine Batterien sind leer"? Fühlen Sie sich entmutigt? Wachen Sie manchmal erschöpft oder ermüdet auf? “Ja” = 2 Punkte, “weiss nicht” = 1 Punkt, “nein” = 0 Punkte 0 - 3 Punkte = keine Erschöpfung Punkte = mittlere Erschöpfung Punkte = starke Erschöpfung > 14 Punkte = Erschöpfungskrise
 Psychosom Med, 60: Fühlen Sie sich oft müde Haben Sie oft Probleme einzuschlafen Wachen Sie Nachts öfters auf Fühlen Sie sich ausgelaugt Fühlen Sie sich in letzter Zeit lustloser als früher Irritieren Sie Kleinigkeiten in letzter Zeit mehr als früher Haben Sie das Gefühl: Meine Batterien sind leer Fühlen Sie sich entmutigt Wachen Sie manchmal erschöpft oder ermüdet auf Ja = 2 Punkte, weiss nicht = 1 Punkt, nein = 0 Punkte Punkte = keine Erschöpfung Punkte = mittlere Erschöpfung Punkte = starke Erschöpfung. > 14 Punkte = Erschöpfungskrise.")
8
Imbalance wird akzeptiert, falls
Model of Effort-Reward-Imbalance (Siegrist, 1996) Mangel an Reziprozität zwischen den persönlichen Kosten (“effort“: 6 Items) und dem Gewinn (“reward“: 11 Items) bei der Arbeit führt zu Stress: ERI (Effort-Reward-Imbalance = Gratifikationskrise) Imbalance wird akzeptiert, falls → keine Alternativen vorhanden sind / Abhängigkeit besteht / Immobilität → strategische Ziele verfolgt werden → intrinsische Motivation vorliegt (z.B. OC) (a) Extrinsische Komponente: “reward” “effort” -Einkommen und Karriere -Anerkennung -Jobsicherheit E / R -Anforderungen -Verpflichtungen (b) Intrinsische Komponente: Motivation Verausgabungsbereitschaft
 Mangel an Reziprozität zwischen den persönlichen Kosten ( effort : 6 Items) und dem Gewinn ( reward : 11 Items) bei der Arbeit führt zu Stress: ERI (Effort-Reward-Imbalance = Gratifikationskrise) Imbalance wird akzeptiert, falls. → keine Alternativen vorhanden sind / Abhängigkeit besteht / Immobilität. → strategische Ziele verfolgt werden. → intrinsische Motivation vorliegt (z.B. OC) (a) Extrinsische Komponente: reward effort -Einkommen und Karriere. -Anerkennung. -Jobsicherheit. E / R. -Anforderungen. -Verpflichtungen. (b) Intrinsische Komponente: Motivation Verausgabungsbereitschaft.")
9
Blutdruck, Herzrate, Herzratenvariabilität und ERI
Vrijkotte et al. (2000) Hypertension, 35:880-6
 Hypertension, 35:")
10
Model of Effort-Reward-Imbalance and Coronary Heart Disease in the Whitehall II Study; follow-up 5.3 years (N=9.095; Bosma et al., 1998) adjusted for age, sex, length of follow-up + alternative work stress model + grade, coronary risk factors, negative affect

12
Exkurs: Model of Effort-Reward-Imbalance (Siegrist, 1996)
prospektive Studien ERI Prädiktor für z.B. kardiovaskuläre Erkrankungen, Typ2-Diabetes, Depression, Alkoholabhängigkeit (quasi-)experimentelle Studien z.B. kardiovaskuläre, hormonelle und immunologische Stress Marker Querschnittuntersuchungen ERI assoziiert mit Indikatoren für Gesundheit und allgemeinem Wohlbefinden (z.B. Frühpensionierung, krankheitsbedingte Fehltage, „lifestyle risk factors“, Schlafstörungen) Aktuelle Übersichtsartikel Siegrist et al. (2004), Tsutsumi & Kawakami (2004), van Vegchel et al. (2005) et al.
experimentelle Studien. z.B. kardiovaskuläre, hormonelle und immunologische Stress Marker. Querschnittuntersuchungen. ERI assoziiert mit Indikatoren für Gesundheit und allgemeinem Wohlbefinden (z.B. Frühpensionierung, krankheitsbedingte Fehltage, „lifestyle risk factors , Schlafstörungen) Aktuelle Übersichtsartikel. Siegrist et al. (2004), Tsutsumi & Kawakami (2004), van Vegchel et al. (2005) et al.")
13
Beanspruchung und Kontrolle Karasek & Theorell: JCQ (Job Content Questionnaire)
4-Quadranten Anforderung gering hoch Kontrolle gering hoch 1) Arbeitsanforderungen 2) Kontrolle Entscheidungsspielraum Weiterentwicklung/Fähigkeiten 3) Soziale Unterstützung Vorgesetzte Mitarbeiter Passiv Hohe Beanspruchung Geringe Beanspruchung Aktiv
 Arbeitsanforderungen. 2) Kontrolle. Entscheidungsspielraum. Weiterentwicklung/Fähigkeiten. 3) Soziale Unterstützung. Vorgesetzte. Mitarbeiter. Passiv. Hohe. Beanspruchung. Geringe. Beanspruchung. Aktiv.")
15
Effort-Reward Imbalance
Wahrscheinlichkeit (adjusted hazard ratios) für kardiovaskuläre Mortalität N=812 (73 Todesfälle); mittlerer Follow-up 25.6 Jahre Tertile 1 = gering 2 = mittel 3 = hoch *kontrolliert für Alter, Geschlecht, Berufsgruppe, Rauchen, körperliche Aktivität, SBD, Gesamt-Cholesterin, BMI Job strain Effort-Reward Imbalance Kivimäki et al. (2002), BMJ, 325:857
 für kardiovaskuläre Mortalität N=812 (73 Todesfälle); mittlerer Follow-up 25.6 Jahre. Tertile. 1 = gering. 2 = mittel. 3 = hoch. *kontrolliert für Alter, Geschlecht, Berufsgruppe, Rauchen, körperliche Aktivität, SBD, Gesamt-Cholesterin, BMI. Job strain. Effort-Reward Imbalance. Kivimäki et al. (2002), BMJ, 325:857.")
16
Conceptual Differences between the Demand-Control (DC) and the Effort-Reward-Imbalance Model (ERI)
Focus on job task: high demands and low control Restriction to situation characteristics Threat to personal control (efficacy, power) Policy implication: Democracy, participation ERI Focus on work contract: non-reciprocity of efforts and rewards Combination of situation and person characteristics Threat to social rewards (esteem, status) Policy implication: Distributive justice, contractual fairness
 Policy implication: Democracy, participation. ERI. Focus on work contract: non-reciprocity of efforts and rewards. Combination of situation and person characteristics. Threat to social rewards (esteem, status) Policy implication: Distributive justice, contractual fairness.")
17
Psychometric assessment
Maslach Burnout Inventory (MBI): EE, DP, LA Vital Exhaustion (VE) Effort-Reward-Imbalance (ERI) Hospital Anxiety and Depression Scale (HADS) HPA axis regulation Cortisol day profiles: 2 work days + 1 leisure day after Dexamethason (0.25mg) premedication 0, +30, +45, +60 min. after awakening, 11am, 3pm, 8pm Allostatic load Anthropometric assessment Cardiovascular parameters Blood samples (fasting state) Urine sample (overnight)
: EE, DP, LA. Vital Exhaustion (VE) Effort-Reward-Imbalance (ERI) Hospital Anxiety and Depression Scale (HADS) HPA axis regulation. Cortisol day profiles: 2 work days + 1 leisure day. after Dexamethason (0.25mg) premedication. 0, +30, +45, +60 min. after awakening, 11am, 3pm, 8pm. Allostatic load. Anthropometric assessment. Cardiovascular parameters. Blood samples (fasting state) Urine sample (overnight)")
18
Laborbesuch mit Messungen und Blutabnahme: N = 190
Studienteilnehmer Laborbesuch mit Messungen und Blutabnahme: N = 190 Fragebögen: N = 180 Speichelcortisolprofile: N = 146 NDex = 122 29 und jünger 30-39 40-49 50 und älter 20 40 60 80 100 Häufigkeit Altersstruktur der Stichprobe Spanne: 26 – 64 Jahre N=125 N=55

20
Effort-Reward-Imbalance
≤ 1 > 1 50 100 150 200 Häufigkeit Effort-Reward-Imbalance Mittel-Wert Min. Max. Effort 15.93 6 30 Reward 44.73 11 55 E/R Ratio (= ERI) 0.71 0.20 4.43 OC 16.35 24 „geringes Risiko“ „hohes Risiko“
 OC „geringes Risiko „hohes Risiko")
21
Reaktionen auf chronischen Stress: Allostatic Load
Allostasis: „stability through change“ (Sterling & Eyer, 1988) Allostatic load: „the wear and tear on the body and brain resulting from chronic overactivity or inactivity of physiological systems that are normally involved in adaptation to environmental challenge“ Versuch einer Definition von potentiell gesundheitsrelevanten biologischen Kosten (sogenannter „Allostatic Load“) aufgrund von Anpassungsleistungen des Körpers an psychischen und physiologischen Stress (McEwen, 1998b; McEwen & Stellar, 1993) = summary indicator of biological risk Summenindikator für biologisches Risiko = cummulative physiological burden exacted on the body through attempts to adapt to life´s demands
 Allostatic load: „the wear and tear on the body and brain resulting from chronic overactivity or inactivity of physiological systems that are normally involved in adaptation to environmental challenge Versuch einer Definition von potentiell gesundheitsrelevanten biologischen Kosten (sogenannter „Allostatic Load ) aufgrund von Anpassungsleistungen des Körpers an psychischen und physiologischen Stress (McEwen, 1998b; McEwen & Stellar, 1993) = summary indicator of biological risk Summenindikator für biologisches Risiko. = cummulative physiological burden exacted on the body through attempts to adapt to life´s demands.")
22
Reaktionen auf chronischen Stress: Allostatic Load
Allostasis: „stability through change“ (Sterling & Eyer, 1988) Allostatic load: „the wear and tear on the body and brain resulting from chronic overactivity or inactivity of physiological systems that are normally involved in adaptation to environmental challenge“ McEwen (1998) N Engl J Med
 Allostatic load: „the wear and tear on the body and brain resulting from chronic overactivity or inactivity of physiological systems that are normally involved in adaptation to environmental challenge McEwen (1998) N Engl J Med.")
23
Allostatic Load-Index
klassische Parameter Cortisol DHEA-S* Adrenalin Noradrenalin Systolischer Blutdruck Diastolischer Blutdruck Taille-Hüft-Verhältnis (WHR) HDL-Cholesterin* Ratio HDL/Gesamtcholest HbA1c erweiterte Parameter Cortisol DHEA-S Adrenalin Noradrenalin Systolischer Blutdruck Diastolischer Blutdruck Taille-Hüft-Verhältnis (WHR) HDL-Cholesterin Ratio HDL/Gesamtcholest HbA1c Allostatic Load: 4 primäre Mediatoren 6 sekundäre Folgen tertiäre Folgen (McEwen & Seeman, 1999) Personen im höchsten bzw. niedrigsten* Quartil erhalten pro Parameter einen Punkt Allostatic Load-Index Diesem Modell folgend kann allostatische Belastung von der wahrgenommenen Belastung bis hin zu Krankheit untergliedert werden in vier primäre Mediatoren der biologischen Regulation (Cortisol, Adrenalin und Noradrenalin, DHEA-S), die über ihre primären Effekte zu sechs sekundären „Outcomes“ führen (Blutdruck, Taille/Hüft-Verhältnis, HDL, Gesamtcholesterin/HDL-Verhältnis und glykolysiertes Hämoglobin), welche schließlich in tertiäre „Outcomes“ münden (=manifeste Erkrankung) Es konnte bislang gezeigt werden, dass dieses Multisystem-Maß den individuellen Markern überlegen ist (Karlamangla et al., 2002; Seeman et al., 2001, 1997) Fibrinogen Fibrin D-Dimere TNF-α C-reaktives Protein (CRP) Triglyceride Glucose (nüchtern) Körperfett in % (BIA)
 HDL-Cholesterin* Ratio HDL/Gesamtcholest. HbA1c. erweiterte Parameter. Cortisol. DHEA-S. Adrenalin. Noradrenalin. Systolischer Blutdruck. Diastolischer Blutdruck. Taille-Hüft-Verhältnis (WHR) HDL-Cholesterin. Ratio HDL/Gesamtcholest. HbA1c. Allostatic Load: 4 primäre Mediatoren 6 sekundäre Folgen tertiäre Folgen (McEwen & Seeman, 1999) Personen im höchsten bzw. niedrigsten* Quartil erhalten pro Parameter einen Punkt. Allostatic Load-Index. Diesem Modell folgend kann allostatische Belastung von der wahrgenommenen Belastung bis hin zu Krankheit untergliedert werden in vier primäre Mediatoren der biologischen Regulation (Cortisol, Adrenalin und Noradrenalin, DHEA-S), die über ihre primären Effekte zu sechs sekundären „Outcomes führen (Blutdruck, Taille/Hüft-Verhältnis, HDL, Gesamtcholesterin/HDL-Verhältnis und glykolysiertes Hämoglobin), welche schließlich in tertiäre „Outcomes münden (=manifeste Erkrankung) Es konnte bislang gezeigt werden, dass dieses Multisystem-Maß den individuellen Markern überlegen ist (Karlamangla et al., 2002; Seeman et al., 2001, 1997) Fibrinogen. Fibrin D-Dimere. TNF-α. C-reaktives Protein (CRP) Triglyceride. Glucose (nüchtern) Körperfett in % (BIA)")
24
Total explained variance: 14%
Allostatic Load (N=181) Cumulative physiological burden exacted on body through attempts to adapt to life´s demands Summary indicator of biological risk e.g. Allostatic Load associated with cognitive decline in older age (McArthur Studies of Sucessful Aging) Blood pressure (syst.+diast.) Waist/Hip ratio High density lipoprotein (HDL) MBI (3 scales) VE ERI/OC HADS (2 scales) Canonical Correlation CR1=.35 p=.02 CR2=.13 p=.62 Total explained variance: 14% HDL/cholesterol ratio HbA1c Noradrenaline In a next step we wanted to investigate the question at hand in a broader sense and instead of focusing on individual parameters from a single biological system, we decided to look at a cumulative measure of chronic stress, McEwen`s model of Allostatic Load. Measures of AL incorporate multiple regulatory systems by including endocrine parameters, cardiovascular, immune, and sympathetic nervous system parameters, as well as blood lipids. There is empirical evidence that supports the hypothesis that higher AL is associated with poorer health. We used canonicals correlations to see whether different measures of chronic work stress are associated with a higher level of accumulated strain or burden There is a significant association between the work stress measures (you see here on the left side) and the physiological parameters (you see on the right). We could show that 14% of the total variance can be explained by our model. Adrenaline Cortisol DHEA-S Body fat in % Triglycerides Glucose Fibrinogen D-dimer Tumor necrosis factor-α C-reactive proteine Bellingrath et al. (submitted)
 Cumulative physiological burden exacted on body through attempts to adapt to life´s demands. Summary indicator of biological risk. e.g. Allostatic Load associated with cognitive decline in older age (McArthur Studies of Sucessful Aging) Blood pressure (syst.+diast.) Waist/Hip ratio. High density lipoprotein (HDL) MBI (3 scales) VE. ERI/OC. HADS (2 scales) Canonical Correlation. CR1=.35 p=.02. CR2=.13 p=.62. Total explained variance: 14% HDL/cholesterol ratio. HbA1c. Noradrenaline. In a next step we wanted to investigate the question at hand in a broader sense and instead of focusing on individual parameters from a single biological system, we decided to look at a cumulative measure of chronic stress, McEwen`s model of Allostatic Load. Measures of AL incorporate multiple regulatory systems by including endocrine parameters, cardiovascular, immune, and sympathetic nervous system parameters, as well as blood lipids. There is empirical evidence that supports the hypothesis that higher AL is associated with poorer health. We used canonicals correlations to see whether different measures of chronic work stress are associated with a higher level of accumulated strain or burden. There is a significant association between the work stress measures. (you see here on the left side) and the physiological parameters (you see on the right). We could show that 14% of the total variance can be explained by our model. Adrenaline. Cortisol. DHEA-S. Body fat in % Triglycerides. Glucose. Fibrinogen. D-dimer. Tumor necrosis factor-α. C-reactive proteine. Bellingrath et al. (submitted)")
25
Allostatic Load und ERI
p =.014 ♀ ♀ t =-1.99 p =.048

26
klassischer Allostatic Load erweiterter Allostatic Load
Allostatic Load und Vitale Erschöpfung t =-2.29 p =.025 ♀ ♀ 8 8 t =-2.29 p =.024 6 6 4 klassischer Allostatic Load erweiterter Allostatic Load 4 2 2 niedrige VE hohe VE niedrige VE hohe VE

27
Vital Exhaustion (Appels et al., 1987)
Definition -unusual fatigue -loss of mental and physical energy -increased irritability -feelings of demoralization Independent risk factor for coronary heart disease (Appels et al., 1993; Kop et al., 1994; Koertge et al., 2002)
")
28
main effect day: F1.8,42.4 =6.5 p =.004 habituation
interaction day x sample: F5.3, =2.3 p =.044 interaction day x exhaustion: F1.8,23 =3.3 p =.049 exhaustion & habituation

29
Slopes and Mann-Whitney U-test:
19 subjects with negative “slopes” ( 179.5) habituation exhaustion: 3.7 6 subjects with positive “slopes” ( 201.7) sensitization exhaustion: 10.3 4.3 Z =-2.5 p =.011 Linear regression: significant prediction of “slopes” by exhaustion (ß =.46 t =2.5 p =.02) The higher the exhaustion (the higher the “slope”-index), the lower the habituation.
 habituation exhaustion: 4.5 subjects with positive slopes ( 201.7) sensitization exhaustion: 10.3 4.3. Z =-2.5 p =.011. Linear regression: significant prediction of slopes by exhaustion (ß =.46 t =2.5 p =.02) The higher the exhaustion (the higher the slope -index), the lower the habituation.")
30
Würdigung und Kritik: Allostatic Load
… …

Ähnliche Präsentationen


Media Landesanstalt für Kommunikation Baden-Württemberg (LFK) Landeszentrale für Medien und Kommunikation.>")


 in Germany elective subject for medical students during.>")


 At RHIC: T ch = 160 ± 10 MeV B = 25 ± 5 MeV 2) S = 1. The hadronic system is thermalized.>")


