Präsentation herunterladen
Die Präsentation wird geladen. Bitte warten

2
Jahrhunderthochwasser Elbe 2002
Aktuelle Bezüge : Lokale Umweltkatastrophen: Jahrhunderthochwasser Elbe 2002 Trockenheiten Austrocknen des Aralsees Extreme Wetterlagen: Hitzesommer Extrem Hurrikane 2005 …… Eigentlich kein unmittelbarer Bezug zum Treibhauseffekt, aber die Wahrnehmung und das Bewusstsein werden geschärft. Siehe Datei V00a_Hitzesommer2003.ppt

3
Extreme Wetterlagen: Hitzesommer 2003
Aktuelle Bezüge : Extreme Wetterlagen: Hitzesommer 2003 Extrem Hurrikane 2005 …… Siehe Dateien: V00a_Hitzesommer2003.ppt V00a2_Hurrikan Saison 2005_Schoenwiese..ppt

5
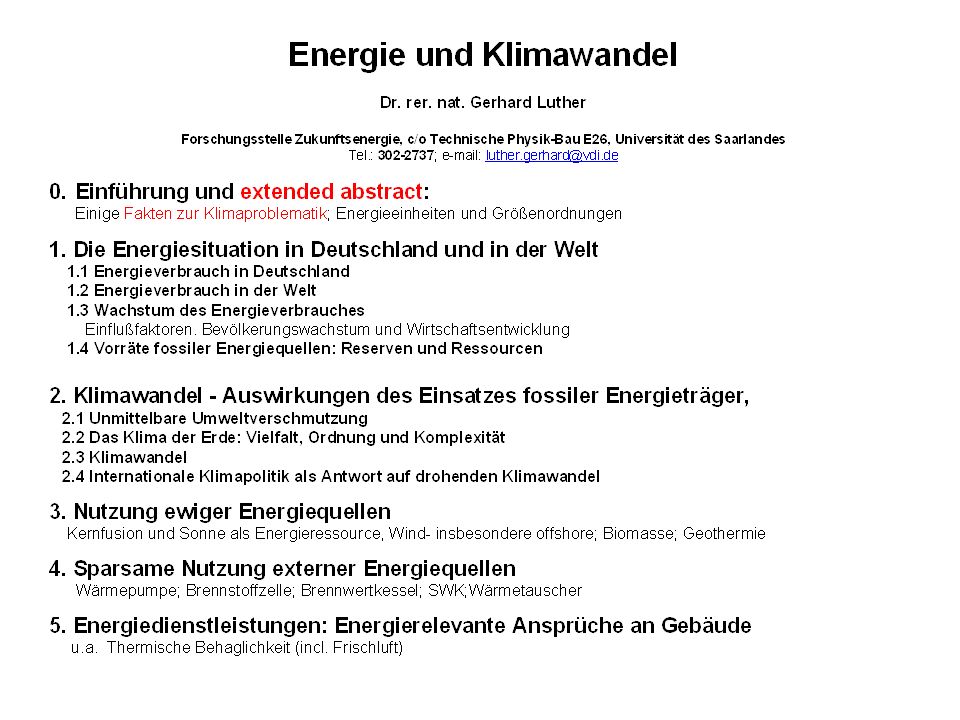
Energie und Klimawandel Forschungsstelle Zukunftsenergie (FZE )
WS 2006/07 Dr. rer. nat. Gerhard Luther Forschungsstelle Zukunftsenergie (FZE ) c/o Technische Physik, Universität des Saarlandes Bau E26 , Zimmer 2.03 Telephon: ; (auch größere Dateien) homepage mit Link zur Vorlesung: Vorlesung: Mittwoch, Uhr, Bau E26, 2.OG., Seminarraum 2.22 Internetseite vorführen !
 c/o Technische Physik, Universität des Saarlandes Bau E26 , Zimmer Telephon: ; (auch größere Dateien) homepage mit Link zur Vorlesung: Vorlesung: Mittwoch, Uhr, Bau E26, 2.OG., Seminarraum Internetseite vorführen !")
6
Energie und Klimawandel
0. Einführung Warum interessiert uns das Thema - der große Zusammenhang 0.2 Einige Fakten zur Einführung in die Problematik Energie und Klima 0.3 Aufbau der Vorlesung 0.4 Energie und Treibhausgase 0.5 Energieeinheiten unf Größenordnungen 0.6 Was ist Energie

7
Energie und Klimawandel
0.1 Energie und Klimawandel 0. Einführung 0.1 Warum interessiert uns das Thema - der große Zusammenhang Es gab und gibt: - lokale Umweltverschmutzung (-veränderung) - globale Umweltprobleme (WEHAB, nicht nur Klima) - endliche und erwartet knappe Ressourcen bei wachsender Bevökerung - eine ungleiche Verteilung und einen großen Nachholbedarf an Lebensstandard Dies alles hängt in großem Ausmaße mit Energienutzung zusammen.
 - globale Umweltprobleme (WEHAB, nicht nur Klima) - endliche und erwartet knappe Ressourcen bei wachsender Bevökerung. - eine ungleiche Verteilung und einen großen Nachholbedarf an Lebensstandard. Dies alles hängt in großem Ausmaße mit Energienutzung zusammen.")
8
Der große globale Zusammenhang
Status und Trends in den Bereichen: - Bevölkerungsentwicklung - WEHAB ( Water, Energy , Hygiene, Agriculture, Biodiversity)
")
9
Bericht des Generalsekretärs Nitin Desai
zum World Summit on Sustainable Development, Johannesburg, 2002 Siehe Datei V00b_WS2002_CriticalTrends .ppt Goto->

10
Siehe Datei V00b_WS2002_CriticalTrends .ppt

11
1. The Link between Energy use and Poverty 2. Access to Electricity
Goto-> 1. The Link between Energy use and Poverty 2. Access to Electricity 3. Biomass Use . IEA: World Energy Outlook 2002, Chap. 13: Energy & Power Quelle:IEA_WEO2002_13-Energy&Poverty.pdf

12
Siehe Datei V00c_Energy_and_Poverty.ppt

13
Es muss für alle reichen
Optimistische Schlussfolgerung: Es reicht für alle Moralische Aufforderung: Es muss für alle reichen

14
Energie und Klimawandel einige Fakten zur Einführung
0.2 Einige Fakten zur Einführung in die Problematik Energie und Klimawandel einige Fakten zur Einführung

15
Wichtigste benutzte Literatur für 0.2 :
1. IPCC-COP6a_Bonn2001_WatsonSpeech: Redemanuskript + Bilder 2. IPCC2001_TAR1: Climate Change 2001, The Scientific Basis insbesondere Technical Summary und die jeweils als Quelle oder „Urquelle“ angegebenen Seiten. 0.2 Einige Fakten zur Einführung in die Problematik .21 Entwicklung des Weltenergieverbrauchs .22 Entwicklung der Bevölkerung The Earth's climate system has changed, globally and regionally, with some of these changes being attributable to human activities Belege, dass sich das Klima verändert hat (T, precipitation pattern, sea level) The Identification of a human Influence on Climate Change Treibhausgase in der Atmosphäre seit der industriellen Revolution .25 Projektionen und Szenarios für das 21. Jahrhundert .26 Was tun? Erste Ansätze der Internationalen Gemeinschaft
 The Identification of a human Influence on Climate Change .24 Treibhausgase in der Atmosphäre seit der industriellen Revolution. .25 Projektionen und Szenarios für das 21. Jahrhundert. .26 Was tun Erste Ansätze der Internationalen Gemeinschaft.")
16
Entwicklung des Weltenergieverbrauchs (in EJ)
0.21 Entwicklung des Weltenergieverbrauchs (in EJ) Nicht erfasst sind: Brennholz, Dung und andere Biomasse (Entwicklungsländer) Quelle:e.g. /BINE_BE_1: Klima und Energie,1998, Abb3, p.3
 Nicht erfasst sind: Brennholz, Dung und andere Biomasse (Entwicklungsländer) Quelle:e.g. /BINE_BE_1: Klima und Energie,1998, Abb3, p.3.")
17
Consumption of all types of energy is growing
Quelle: UN Report „Global Change - Global Opportunity“, World Summit 2002, Johannesburg, p14

18
World Total Primary Energy Supply by Fuel (Mtoe)
Evolution from 1971 to 2004 of World Total Primary Energy Supply by Fuel (Mtoe) __500 [EJ/a] __400 [EJ/a] Ungebrochenes Wachstum a *Excludes electricity trade. **Other includes geothermal, solar, wind, heat, etc. Quelle: IEA 2006, IEA2006_Key-World-EnergyStatistics_82p.pdf
 __500 [EJ/a] __400 [EJ/a] Ungebrochenes Wachstum. a. *Excludes electricity trade. **Other includes geothermal, solar, wind, heat, etc. Quelle: IEA 2006, IEA2006_Key-World-EnergyStatistics_82p.pdf.")
19
Aktuelle IEA –Prognose aus dem World Energy Outlook 2006
Wie geht’s weiter? Was kann man tun? Aktuelle IEA –Prognose aus dem World Energy Outlook 2006 BQuelle: Vorträge von Claude Mandil auf der CC-Konferenz, Monterrey, Mexico, und Skhirat, Morocco, Zum Original: bzw.: IEA2006_Mandil_Bridging-theEnergygap_Mexico-Monterrey _speech-ppt.pdf ; IEA2006_Mandil_Situation-energetiqueMondiale_Skhirat_ppt.pdf

20
( BAU) __750 [EJ/a] __500 [EJ/a]
Quelle: IEA Vortrag Mandil, Folie 2
![( BAU) __750 [EJ/a] __500 [EJ/a]](http://slideplayer.org/slide/645920/1/images/20/%28+BAU%29+__750+%5BEJ%2Fa%5D+__500+%5BEJ%2Fa%5D.jpg "Quelle: IEA Vortrag Mandil, Folie 2.")
21
BAU Quelle: IEA Vortrag Mandil, Folie 1

22
CCS Quelle: IEA Vortrag Mandil, Folie 6

23
CCS Quelle: IEA 2005 –Mandil: IEA2005-Mandil_Coaltrans_WorldCoalConference_ppt.pdf

24
0.22 Entwicklung der Weltbevölkerung
Quelle:/Heinloth 97, p21/

25
UN 2002: Weltbevölkerung wächst noch auf ca. 11 G Menschen 2050: 9 Milliarden 2000: 6 Milliarden BQuelle: Bundesinstitut für Bevölkerungsforschung (BiB) : Bevölkerung -FAKTEN – TRENDS – URSACHEN – ERWARTUNGEN (2004), Abb.33, p.74
 : Bevölkerung -FAKTEN – TRENDS – URSACHEN – ERWARTUNGEN (2004), Abb.33, p.74.")
26
The Earth's climate system has changed,
0.23 The Earth's climate system has changed, globally and regionally , with some these changes being attributable to human activities.

27
0.231 Das Klima hat sich bereits entsprechend der Erwartungen verändert
The Earth has warmed 0.6± 0.2 [K] since 1860 with the last two decades being the warmest of the last century; The increase in surface temperatures over the 20th Century for the Northern hemisphere is likely to be greater than that for any other century in the last 1000 years; Precipitation patterns have changed with an increase in heavy precipitation events in some regions; Sea level has risen cm since 1900; most non-polar glaciers are retreating; and the extent and thickness of Arctic sea ice is decreasing in summer; Quelle: IPCC-COP6a_Bonn2001_WatsonSpeech: p 1-Summary

28
Global Mean Temperatures 1860-2001
Quelle: erhalten 2002_0128; wmo_climate2001_fig1....jpeg /

29
Aktueller Stand: Oberflächennahe Erdtemperatur
_____2005_1-11 Erhalten 2005_1221

30
Millennial Northern Hemisphere (NH) Temperature from AD 1000-1999
Source: Mann et al The 1990s were warmer than at anytime during the last 1000 years Quelle: IPCC_2000_WatsonSpeech: Fig 1

31
IPCC 2001: TAR_wg1: E. The Identification of a human Influence on CC
0.232 The Identification of a human Influence on Climate Change IPCC 2001: TAR_wg1: E. The Identification of a human Influence on CC E.8 Synopsis „ In the light of new evidence and taking into account the remaining uncertainties, most of the observed warming over the last 50 years is likely to have been due to the increase greenhouse gas concentrations. “ Quelle: IPCC_2001_TAR_TS: p. 61

32
Treibhausgase in der Atmosphäre seit der industriellen Revolution
0.24 Treibhausgase in der Atmosphäre seit der industriellen Revolution

33
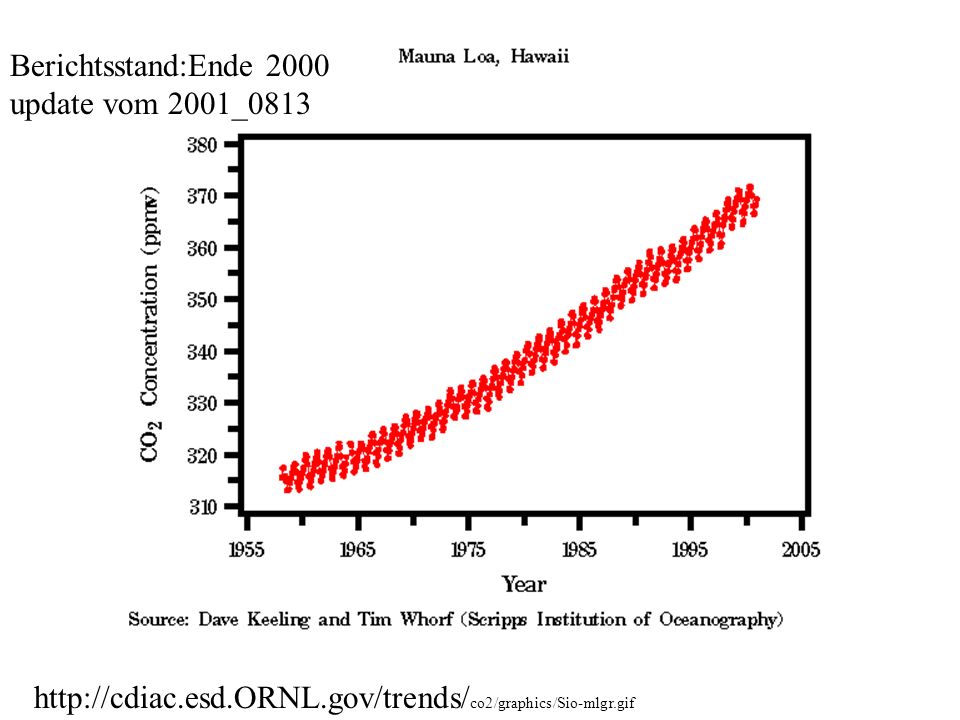
Human activities are increasing
the atmospheric concentrations of: greenhouse gases that warm the atmosphere and, in some regions, of sulfate aerosols that cool the atmosphere; Most of the observed warming of the last 50 years is attributable to human activities

34
Berichtsstand:Ende 2000 update vom 2001_0813
35
Berichtsstand:Mitte 2005 update vom 2006_0130
Berichtsstand:Mitte 2005 update vom 2006_0130

36
Carbon emissions and uptakes since 1800 (Gt C)
Quelle: IPCC-COP6a_Bonn2001_wg1_3_Watson 6

37
SPM 3 Quelle: IPCC-COP6a_Bonn2001_wg1_1_Houghton

38
Projektionen und Szenarios
0.25 Projektionen und Szenarios für das 21. Jahrhundert-

39
Main climate changes Higher temperatures - especially on land
0.253 Main climate changes Higher temperatures - especially on land Sea level rise Hydrological cycle more intense Changes at regional level Quelle: IPCC-COP6a_Bonn2001_wg1_1_Houghton

40
CO2, temperature, precipitation and sea level in the 21.th century
All IPCC projections show that the atmospheric concentration of CO2 will increase significantly during the 21th century in the absence of climate change policies; Climate models project that the Earth will warm 1.4 to 5.8 °C between and 2100, with most land areas warming more than the global average; Precipitation will increase globally, with increases and decreases locally, with an increase in heavy precipitation events over most land areas; Sea level is projected to increase 8-88 cm between 1990 and 2100; Models project an increase in extreme weather events, e.g. heatwaves, heavy precipitation events, floods, droughts, fires, pest outbreaks, mid-latitude continental summer soil moisture deficits, and increased tropical cyclone peak wind and precipitation intensities. Quelle: IPCC-COP6a_Bonn2001_WatsonSpeech: p 1-Summary

41
Global mean surface temperature is projected to increase during the 21st century
Quelle: IPCC-COP6a_Bonn2001_WatsonSpeech: Fig 11

42
Projected surface temperatures for the 21st century would be unheralded in the last 1000 years
Quelle: IPCC-COP6a_Bonn2001_WatsonSpeech: Fig 12

43
Tens of millions of people are projected to be at risk of being displaced by sea level rise Assuming 1990s Level of Flood Protection Source: R. Nicholls, Middlesex University in the U.K. Meteorological Office Climate Change and Its Impacts: A Global Perspective. Quelle: IPCC-COP6a_Bonn2001_WatsonSpeech: Fig 18

44
both beneficial and adverse effects on
Projected changes in climate will have both beneficial and adverse effects on water resources, agriculture, natural ecosystems human health, but: the larger the changes in climate the more the adverse effects dominate Quelle: IPCC-COP6a_Bonn2001_WatsonSpeech: p 2-Summary

45
Aus dem „Stern Report“ der UK-Regierung:
Quelle: „Stern Report“, UK-Government:

46
Internationalen Gemeinschaft
0.26 Was tun ? Erste Ansätze der Internationalen Gemeinschaft

47
Such a level should be achieved within a time-frame sufficient :
UNITED NATIONS FRAMEWORK CONVENTION ON CLIMATE CHANGE: UNFCC92: Rio de Janeiro 1992 ARTICLE 2: OBJECTIVE The ultimate objective of this Convention .... is to achieve, .… stabilization of greenhouse gas concentrations in the atmosphere at a level that would prevent dangerous anthropogenic interference with the climate system. Such a level should be achieved within a time-frame sufficient : to allow ecosystems to adapt naturally to climate change. to ensure that food production is not threatened, and to enable economic development to proceed in a sustainable manner. Quelle: IPCC-COP6a_Bonn2001_wg1_1_Houghton

48
Stabilization of the atmospheric concentration of carbon dioxide will require significant emissions reductions Quelle: IPCC-COP6a_Bonn2001_WatsonSpeech: Fig 19

49
UNFCC : Die Konferenzen der Vertragsstaaten
COP := Conference of the Parties) - “Klimagipfel” COP Berlin COP Genf COP Kyoto COP Buenos Aires COP Bonn COP Den Haag COP6b 2001 Bonn COP Marrakesh COP Neu-Delhi COP Mailand COP Buenos Aires COP Montreal COP Nairobi
 - Klimagipfel COP Berlin. COP Genf. COP Kyoto. COP Buenos Aires. COP Bonn. COP Den Haag. COP6b 2001 Bonn. COP Marrakesh. COP Neu-Delhi. COP Mailand. COP Buenos Aires. COP Montreal. COP Nairobi.")
50
Weblinks der letzten COP‘s
Programm und Tagesordnung der COP 11, 25. November bis 9. Dezember 2005 Programm und Tagesordnung der COP 12, 6. bis 17. November 2006 12_klimakonferenz/doc/38051.php 12. Weltklimakonferenz, November 2006 in Nairobi Quelle der Links: Wikipedia Von „

51
Die Industrieländer (!!) verpflichten sich,
COP 3 : Das Kyoto Protokoll Übereinkommen: Die Industrieländer (!!) verpflichten sich, ihre gemeinsamen Emissionen von insgesamt 6 Treibhausgasen für den Zeitraum 2008 bis 2012 um mind. 5 % gegenüber 1990 zu reduzieren
 verpflichten sich, ihre gemeinsamen Emissionen von insgesamt 6 Treibhausgasen. für den Zeitraum 2008 bis um mind. 5 % gegenüber 1990 zu reduzieren.")
52
Weitere Verpflichtungen der Vertragsparteien:
Kyoto- Protokoll Weitere Verpflichtungen der Vertragsparteien: Verbesserung der Energieeffizienz in den Volkswirtschaften Entwicklung u. Förderung von erneuerbaren Energien und Technologien zum Klimaschutz Vermeidung von negative Klimaauswirkungen bei Umsetzung von Maßnahmen

53
System zum Emissionshandel
Kyoto Protokoll: Drei Mechanismen zur Zielereichung: System zum Emissionshandel CDM = Clean Development Mechanism (Mechanismus für umweltverträgliche Zusammenarbeit mit Entwicklungs ländern) JI = Joint Implementation ( Gemeinsame Umsetzung mit anderen Industrieländern)
 JI = Joint Implementation ( Gemeinsame Umsetzung mit anderen Industrieländern)")
54
Das Kyoto Protocol und seine Schwellen
Stand am : 84 Vertragsstaaten haben unterzeichnet 125 Vertragsstaaten haben bereits ratifiziert 44,2 % der auf Industrieländer entfallenen Emissionen erreicht Grenzwert für In-Kraft-Tretung des Protokolls: 55 % Urquelle:

55
Quelle: IEA (International Energy Agency)
")
56
CO2 emissions continue to grow
Quelle: UN Report „Global Change - Global Opportunity“, World Summit 2002, Johannesburg, p16

57
Soll: CO2 Sparen Quelle: UN Report „Global Change - Global Opportunity“, World Summit 2002, Johannesburg, p17

58
Ist: CO2 Sparer Quelle: UN Report „Global Change - Global Opportunity“, World Summit 2002, Johannesburg, p17

59
IPCC Website

60
IPCC: Climate Change 2001- The Scientific Basis
Summary for Policymakers (SPM) Drafted by a team of 59 Approved ‘sentence by sentence’ by WGI plenary (99 Governments and 45 scientists) 14 chapters 881 pages 120 Lead Authors 515 Contributing Authors 4621 References quoted Quelle: IPCC-COP6a_Bonn2001_wg1_1_Houghton
 Drafted by a team of 59. Approved ‘sentence by sentence’ by WGI plenary (99 Governments and 45 scientists) 14 chapters. 881 pages. 120 Lead Authors. 515 Contributing Authors References quoted. Quelle: IPCC-COP6a_Bonn2001_wg1_1_Houghton.")
61
Quelle: IPCC-COP6a_Bonn2001_wg1_1_Houghton

62
Gateway http://ipcc-ddc.cru.uea.ac.uk/
Umfassende Information über Climate Change beim IPCC lokal im Netz IPCC- homepage: presentations: speeches: Wichtigste SpezialInfos bei : IPCC Data Distribution Centre Gateway

63
Exkurs UrQuelle der Original-Vortragsfolien + SpeakingNotes:
Präsentation des „Stern Report“ der UK-Regierung am in HM Treasury: Goto: V00d_Stern‘sPresentation UrQuelle der Original-Vortragsfolien + SpeakingNotes: Lokal: SternReview_on-theEconomics-ofClimateChange-CC_2006ppt.pdf SternReview_on-theEconomics-ofClimateChange-CC_2006_ppt_SpeakingNotes.pdf

64
Ablage

65
0. Einführung: Energie und CC im großen Zusammenhang
EKW1: Wdh_3. Stunde 0. Einführung: Energie und CC im großen Zusammenhang 0.1 Warum interessiert uns das Thema - der große Zusammenhang 0.2 Einige Fakten zur Einführung in die Problematik .21 Entwicklung des Weltenergieverbrauchs .22 Entwicklung der Bevölkerung The Earth's climate system has changed, globally and regionally, with some of these changes being attributable to human activities Belege, dass sich das Klima verändert hat (T, precipitation pattern, sea level) The Identification of a human Influence on Climate Change Treibhausgase in der Atmosphäre seit der industriellen Revolution .25 Projektionen und Szenarios für das 21. Jahrhundert .26 Was tun? Erste Ansätze der Internationalen Gemeinschaft
 The Identification of a human Influence on Climate Change .24 Treibhausgase in der Atmosphäre seit der industriellen Revolution. .25 Projektionen und Szenarios für das 21. Jahrhundert. .26 Was tun Erste Ansätze der Internationalen Gemeinschaft.")
66
Global Mean Temperatures 1860-2002
Combined annual land-surface, air and sea-surface temperatures from relative to for the globe; the solid curves have sub-decadal time-scale variations smoothed with a binomial filter. (Sources: Climatic Research Unit, University of East Anglia and Hadley Centre, The Met Office) ‘98 ‘02 Quelle: erhalten 2003_0227; Speicher: WMO_Rep684_Climate2002_PR.pdf, p.5/
 ‘98. ‘02. Quelle: erhalten 2003_0227; Speicher: WMO_Rep684_Climate2002_PR.pdf, p.5/")
Ähnliche Präsentationen


 Natural Sources SNAP11.>")


 in Germany elective subject for medical students during.>")


>")
>")
 0681/ 302-2737; Fax /302-4676 (für.>")
>")

