Präsentation herunterladen
Die Präsentation wird geladen. Bitte warten

1
Softwaretechnologie für Fortgeschrittene Teil Eide Stunde V: Modelling (with contributions from Christian-Emil Ore, Jon Holmen, and other colleagues at the Unit for Digital Documentation, University of Oslo and from Martin Dörr and Stephen Stead, CIDOC-CRM SIG) Köln 4. Februar 2016

2
Reminder: Event centric data model source recording result Event ”recording” Types –Photographing –Repro –Copying –Scanning Media object Types –Analogue negative –Analogue positive –Digital photo –Digital copy –…. PersonPlaceTime span whenperformed bywhere Source ofResults in Media object Types –External –Analogue negative –Analogue positive –Digital photo –Digital copy –….

3
Reminder: Data model (example) Separation between “information object” and “information carriers” Event 1 Camera, 1966 media_unit a negative film media_unit b paper positive media_unit c file from scanner media_unit d file Event 2 Copying, ? Event 3 Scan, 1997 Event 4 Resizing, 2004 media_group (information object) Is carrier of discipline cataloguing discipline cataloguing …
 Is carrier of discipline cataloguing discipline cataloguing ….")
4
Remember: Database Common schema media_group – id – process_xml – tech_metadata media_unit – tech_metadata – default {0, 1} schema_setup – process_spec – delete_limit process – process_spec – status {0, 1, 2, 9} Discipline schema 2 image_card – media_group_id – concent_metadata subject specific tables Discipline schema 1 image_card – media_group_id – concent_metadata subject specific tables

5
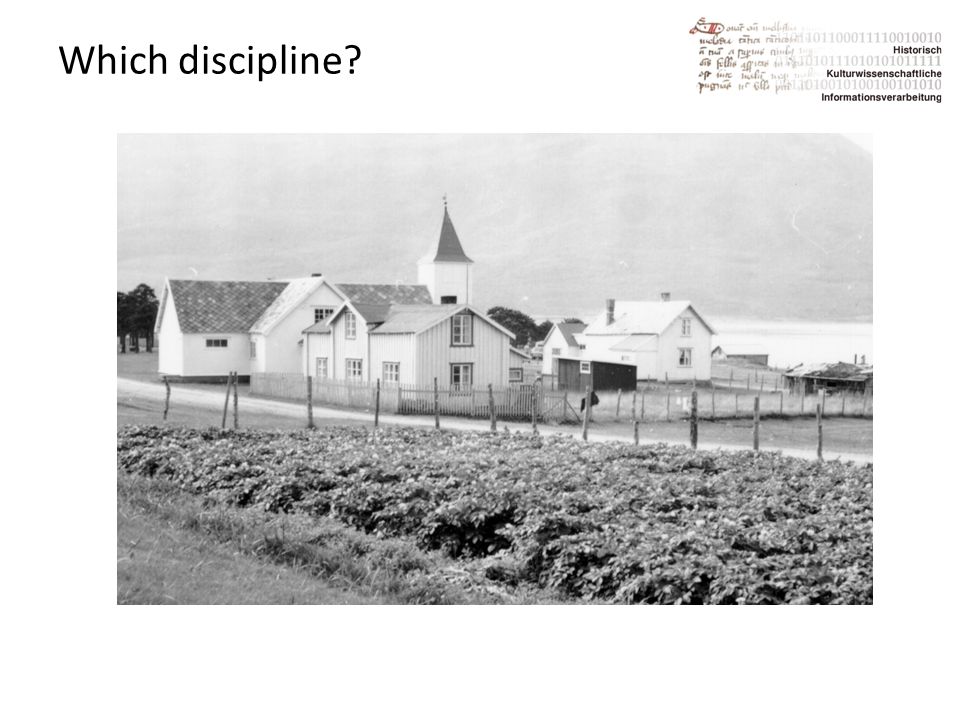
Which discipline?

9
Identical photographs?

10
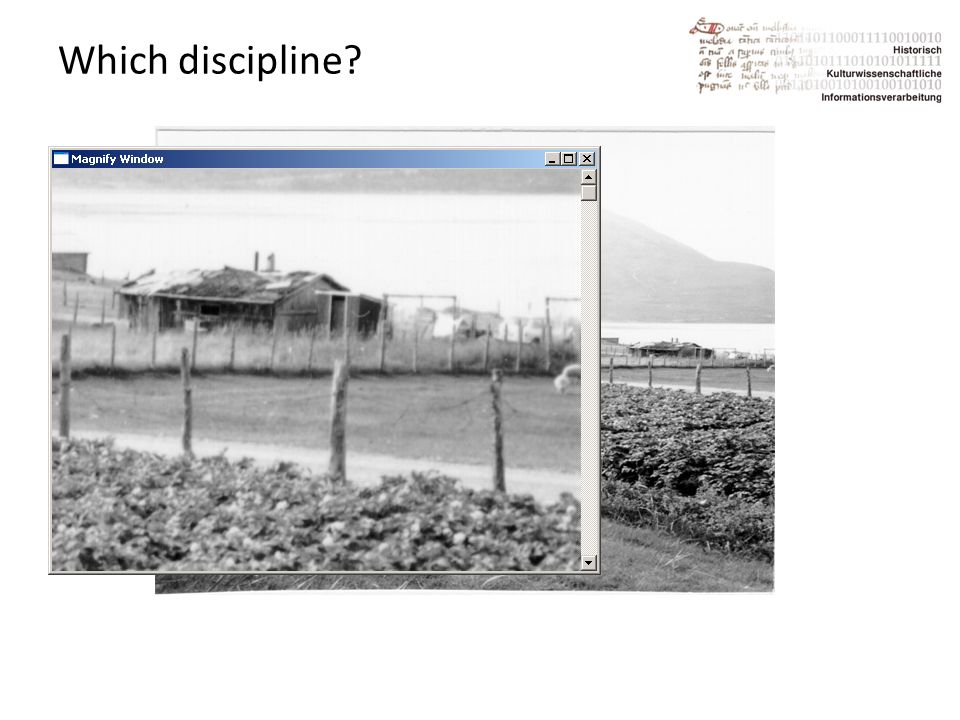
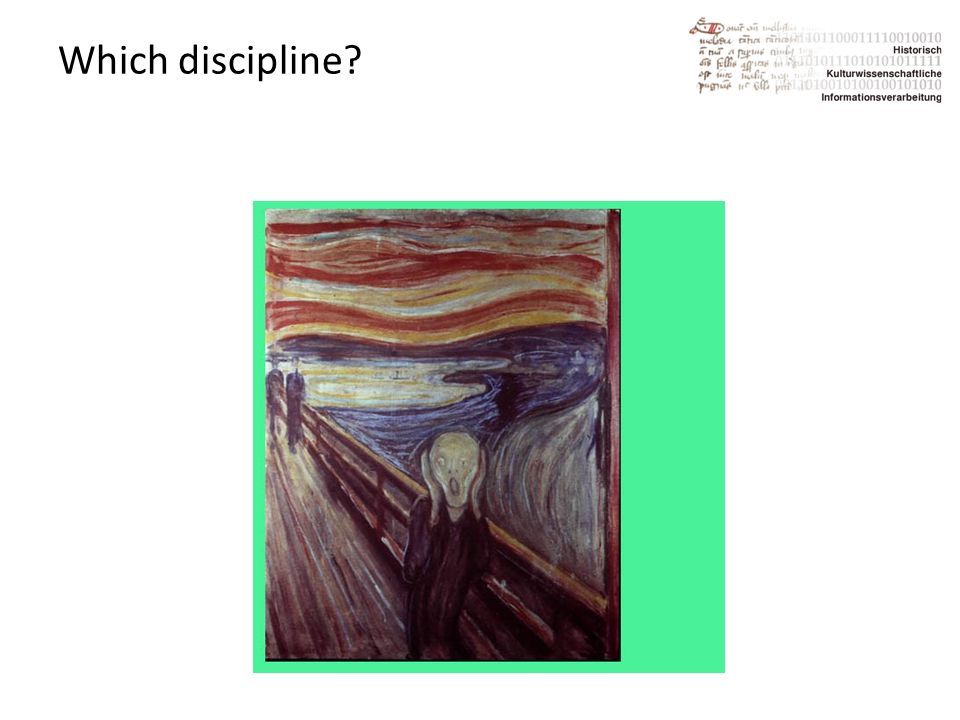
Which discipline?

13
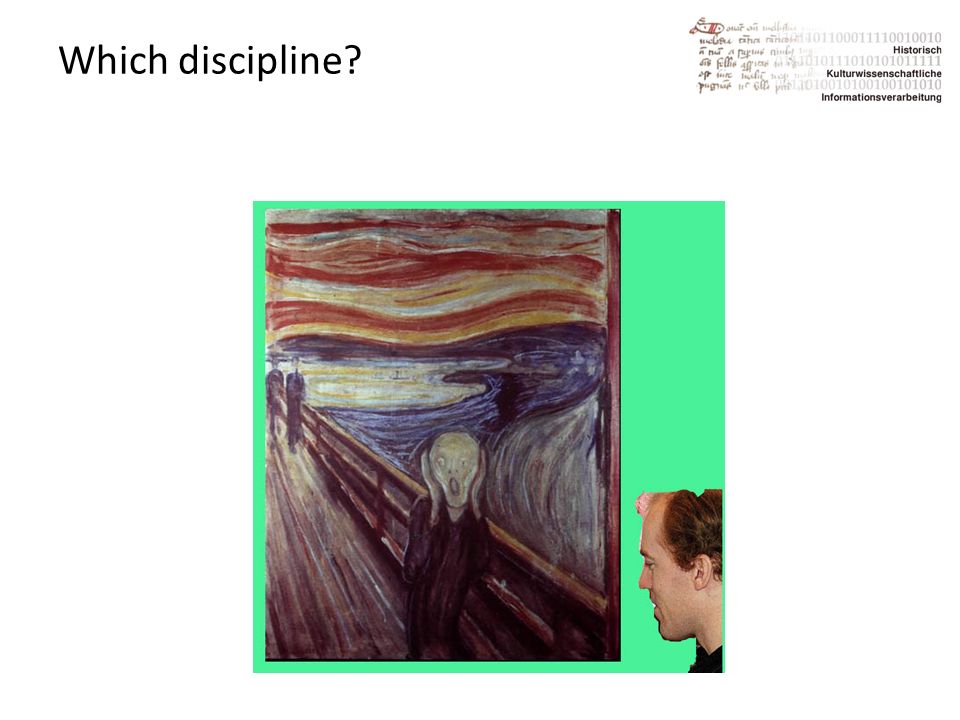
Event centric data model Media Object A Type: Digital copy ”Skrik” Media Object B Type: Digital copi: ”The Imsdal man” Source for Event Type: Use of photoshop Media Object D Type: Collage ”The Imsdal man Meets Munch” PersonPlaceTimespan whenPerformed bywhen Results in

14
Date model, concepts and things Media group -unit A Information Object ”Skrik” Media Object A Type: Digital copy Based on Media group - unit B Information Object ”The Imsdal man” Media Object B Type: Digital copy Media Object C Type: Digital copy Media group -unit C Information Object ”The Imsdal man Meets Munch” … Physical thing Conceptual object

15
Model of vs. model for

16
Modelling strategies: examples Modelling for production – Computer science – e.g. UML – Digital Humanities – e.g. TEI Modelling for understanding – Digital Humanities – (Humanities, natural sciences, …) Modelling for data integration – Computer science – e.g. Semantic Web – Digital Humanities – e.g. TEI – Cultural heritage – e.g. CIDOC-CRM
 Modelling for data integration – Computer science – e.g. Semantic Web – Digital Humanities – e.g. TEI – Cultural heritage – e.g. CIDOC-CRM.")
17
17 Introducing CIDOC-CRM Historical Archives… Type:Text Title: Protocol of Proceedings of Crimea Conference Title.Subtitle: II. Declaration of Liberated Europe Date: February 11, 1945 Creator:The Premier of the Union of Soviet Socialist Republics The Prime Minister of the United Kingdom The President of the United States of America Publisher:State Department Subject:Postwar division of Europe and Japan “ The following declaration has been approved: The Premier of the Union of Soviet Socialist Republics, the Prime Minister of the United Kingdom and the President of the United States of America have consulted with each other in the common interests of the people of their countries and those of liberated Europe. They jointly declare their mutual agreement to concert… ….and to ensure that Germany will never again be able to disturb the peace of the world…… “ Documents Metadata About…

18
18 Images, non-verbose… Type:Image Title: Allied Leaders at Yalta Date: 1945 Publisher:United Press International (UPI) Source:The Bettmann Archive Copyright:Corbis References:Churchill, Roosevelt, Stalin Photos, Persons Metadata About…
 Source:The Bettmann Archive Copyright:Corbis References:Churchill, Roosevelt, Stalin Photos, Persons Metadata About…")
19
19 Places and Objects TGN Id: 7012124 Names: Yalta (C,V), Jalta (C,V) Types: inhabited place(C), city (C) Position: Lat: 44 30 N,Long: 034 10 E Hierarchy: Europe (continent) <– Ukrayina (nation) <– Krym (autonomous republic) Note: …Site of conference between Allied powers in WW II in 1945; …. Source: TGN, Thesaurus of Geographic Names Places, Objects About… Title: Yalta, Crimean Peninsula Publisher: Kurgan-Lisnet Source: Liaison Agency

20
20 The Integration Problem (1) Problem 1: identification of things – Actors, Roles, proper names: The Premier of the Union of Soviet Socialist Republics Allied leader, Allied power Joseph Stalin…. – Places Jalta, Yalta Krym, Crimea – Events Crimea Conference, “Allied Leaders at Yalta”,“… conference between Allied powers” “Postwar division” – Objects and Documents: The photo, the agreement text

21
21 Problem 2: hidden (implicit) entities (typically under “title”) – Actors Allied leader, Allied power – Places Yalta, Crimea – Events Crimea Conference, “Allied Leaders at Yalta”,“… conference between Allied powers” “Postwar division” Solution: – Make better metadata structures: but what are the relevant elements? The Integration Problem (2)
.")
22
22 Explicit Events, Object Identity, Symmetry P14 performed P11 participated in P94 has created E31 Document “Yalta Agreement” E7 Activity “Crimea Conference” E65 Creation Event * E38 Image P86 falls within P7 took place at P67 is referred to by E52 Time-Span February 1945 P81 ongoing throughout P82 at some time within E39 Actor E53 Place 7012124 E52 Time-Span 1945-02-11

23
23 The Intellectual Role of the CRM Legacy systems Legacy systems Data bases World Phenomena ? Data structures & Presentation models Conceptualization abstracts from approximates explains, motivates organize refer to Data in various forms

24
24 Top-level classes useful for integration participate in E39 Actors E55 Types E28 Conceptual Objects E18 Physical Thing E2 Temporal Entities E41 Appellations affect or / refer to refer to / refine refer to / identify location at within E53 Places E52 Time-Spans

25
Event centric data model Media Object A Type: Digital copy ”Skrik” Media Object B Type: Digital copi: ”The Imsdal man” Source for Event Type: Use of photoshop Media Object D Type: Collage ”The Imsdal man Meets Munch” PersonPlaceTimespan whenPerformed bywhen Results in

26
26 Visual Content and Subject E24 Physical Man-Made Thing E55 Type E1 CRM Entity P62 depicts (is depicted by) P62.1 mode of depiction P65 shows visual item (is shown by) E36 Visual Item P138 represents (has representation) E73 Information Object E38 Image P67 refers to (is referred to by) E84 Information Carrier P128 carries (is carried by) P138.1 mode of depiction E37 Mark E34 Inscription
 P62.1 mode of depiction P65 shows visual item (is shown by) E36 Visual Item P138 represents (has representation) E73 Information Object E38 Image P67 refers to (is referred to by) E84 Information Carrier P128 carries (is carried by) P138.1 mode of depiction E37 Mark E34 Inscription")
27
Date model, concepts and things Media group -unit A Information Object ”Skrik” Media Object A Type: Digital copy Based on Media group - unit B Information Object ”The Imsdal man” Media Object B Type: Digital copy Media Object C Type: Digital copy Media group -unit C Information Object ”The Imsdal man Meets Munch” … Physical thing Conceptual object

28
II 0. UML 2.0 (2003 / 04 ff.) 28 UML ist eine Sammlung von "graphischen Sprachen", d.h. Regelsystemen für die Konstruktion graphischer Schemata, die: unterschiedliche Perspektiven von Anforderungen an Systeme und Entwürfen von Systemteilen, sowie deren Zusammenwirken darstellen, einander dabei überlappen können und unabhängig voneinander verwendet werden können. Am wichtigsten: Klassenmodelle beschreiben den strukturellen Aufbau eines Systems, Anwendungsfallmodelle (Use Cases) beschreiben die Interaktion mit dem System aus Benutzersicht.
 beschreiben die Interaktion mit dem System aus Benutzersicht..")
29
II 1. Klassendiagramme 29 Objekt „Mitarbeiter“ (kann Attribute und Methoden haben) Programmierung
 Programmierung")
30
II 1. Klassendiagramme 30 Binäre Assoziation beschreibt die Beziehungen zwischen Klassen

31
II 1. Klassendiagramme 31 Multiplizität gibt an, wie viele Objekte an einer Assoziation beteiligt sein können.

32
II 1. Klassendiagramme 32 Reflexive Assoziation verbindet Objekte einer Klasse miteinander.

33
II 1. Klassendiagramme 33 Aggregation verbindet beliebig viele Klassen zu einer übergeordneten.

34
II 1. Klassendiagramme 34 Generalisierungsbeziehung zwischen Superklasse und Subklasse.

35
II 2. Anwendungsfalldiagramme 35 Das Verhalten eines Systems kann als Sammlung von Anwendungsfällen ( = use cases) beschrieben werden. Ein Anwendungsfall beschreibt eine Klasse möglicher Interaktionen. Konkrete Anwendungsfälle heißen auch Szenarien. ( scenario based design.) Anwendungsfälle werden in strukturiertem Text beschrieben. Alle möglichen Anwendungsfälle - oder ein für ein bestimmtes Teilsystem relevanter Teil - werden als Anwendungsfalldiagramm realisiert.
 beschrieben werden. Ein Anwendungsfall beschreibt eine Klasse möglicher Interaktionen. Konkrete Anwendungsfälle heißen auch Szenarien. ( scenario based design.) Anwendungsfälle werden in strukturiertem Text beschrieben. Alle möglichen Anwendungsfälle - oder ein für ein bestimmtes Teilsystem relevanter Teil - werden als Anwendungsfalldiagramm realisiert..")
36
II 2. Anwendungsfalldiagramme 36 Anwendungsfall als strukturierter Text (auch als Aktivitäts – oder Zustandsdiagramme) Beispiel: "Buch an einem Selbstausleiheautomaten ausleihen" Normallfall: 1.BenutzerIn liest Ausweis in System ein; System validiert Ausweis. 2. BenutzerIn wählt "Ausleihen"; System aktiviert Ausleihfunktion. 3.BenutzerIn liest Buchcode ein; System identifiziert das Buch, registriert Ausleihe, deaktiviert das Diebstahletikett. Auch Sonderfälle
 Beispiel: Buch an einem Selbstausleiheautomaten ausleihen Normallfall: 1.BenutzerIn liest Ausweis in System ein; System validiert Ausweis. 2. BenutzerIn wählt Ausleihen ; System aktiviert Ausleihfunktion. 3.BenutzerIn liest Buchcode ein; System identifiziert das Buch, registriert Ausleihe, deaktiviert das Diebstahletikett. Auch Sonderfälle.")
37
II 2. Anwendungsfalldiagramme 37 Akteur

38
II 2. Anwendungsfalldiagramme 38 Anwendungsfall

39
II 2. Anwendungsfalldiagramme 39 Anwendungsfall- diagramm

40
II 2. Anwendungsfalldiagramme 40 Include: Bindet anderen Anwendungsfall ein, der an mehreren Stellen genutzt werden kann.

41
II 2. Anwendungsfalldiagramme 41 Extend: Modelliert Varianten, die einen Basisanwendungsfall abwandeln.

42
II 3. Zustandsdiagramme 42 Zustandsdiagramme modellieren das dynamische zeitliche Verhalten eines Systems. Auch state machine state diagram Mögliche Zustände der Objekte einer Klasse oder eines Teilsystems. Dynamik des Systemverhaltens: Reaktionen auf äußere Ereignisse.

43
II 3. Zustandsdiagramme 43

44
II 4. Aktivitätsdiagramme 44 Aktivitätsdiagramme beschreiben Abläufe in einem System. Verbinden Aktivitäten, einen Steuerfluss und Objektzustände miteinander. Erinnern stark an traditionelle "Flussdiagramme" (und haben auch alle ihrer Nachteile).
..")
45
II 4. Aktivitätsdiagramme 45

46
II 5. Interaktionssicht 46 Ziel: Darstellung der Interaktion ausgewählter Objekte in zeitlicher Folge. Entweder als Sequenzdiagramme, die die Zeitachse in den Mittelpunkt rücken … … oder als Zusammenarbeitsdiagramme die Objektstruktur und Aufrufe der Objekte in den Vordergrund rücken. (Beide Diagrammtypen sind logisch äquivalent!)
.")
47
II 5. Interaktionssicht 47 Als Sequenzdiagramm …

48
II 5. Interaktionssicht 48 … und als Zusammenarbeitsdiagramm.

49
II 6. Paketdiagramme 49 Ziel: Aufteilung eines großen auf mehrere kleine Systeme. Innerhalb der Pakete müssen Namen eindeutig sein – aber eben nicht zwischen Ihnen. (Vgl. Namespacekonzept in XML.)
.")
50
II 6. Paketdiagramme 50

51
II 7. Komponentendiagramme 51 Ziel: Aufteilung der Gesamtfunktionalität eines Systems auf mehrere Softwaremodule, die: Möglichst unabhängig voneinander entwickelt / gewartet werden können. Nur über genau definierte Schnittstellen miteinander kommunizieren.

52
II 7. Komponentendiagramme 52

53
II 8. Verteilungsdiagramme 53 Ziel: Aufteilung der Gesamtfunktionalität eines Systems auf mehrere Hardwaremodule (Server).
..")
54
II 8. Verteilungsdiagramme 54

Ähnliche Präsentationen


 Sandra Meißl 26.07.2001.>")

 Ontologie für die Dokumentation in den Kulturwissenschaften – ISO 21127: A Reference.>")


